Keeping Track of Open Positions: Legs, Days to Expiry and Mark-to-Market P/L
What an open-positions record needs to be useful: every leg, days to expiry, and profit or loss at the latest available mark. Build one by hand with three worked rows, then see how MetisTrades keeps the same list current.

What it is and why it matters
An open position is any trade that still has exposure: contracts you have sold or bought that have not yet been closed, expired, assigned or exercised. An open-positions view is the single list of all of them, in one place, with enough detail that you can decide what needs attention today.
Most traders can name their open trades from memory when they hold three. At fifteen, across two accounts, with a couple of rolls in the history, memory stops working. You end up checking the broker's position screen, which shows you what you hold but not what you paid, or a spreadsheet you last updated eleven days ago.
A useful open-positions record answers four questions at a glance:
- What am I actually holding? The symbol, the strategy, and every leg — each option contract or stock holding that makes up the position, with its own side, quantity, strike and expiration.
- How urgent is it? Days to expiry (DTE) — the number of calendar days left before the contract expires. A seven-day position behaves very differently from a forty-two day one.
- Where does it stand? What you collected or paid to open it, against what it would cost to close it now.
- How much of the trade is already done? If you sold a put for 1.50 and it now marks at 0.60, you have captured most of the premium and the remaining reward is small.
Two terms matter before we start counting. Credit is money collected when you open a trade — a short position. Debit is money paid — a long position. And a mark is a single reference price used to value an option, usually the midpoint between bid and ask or a price supplied by the quote source. A mark is a valuation input, not a promise that you can trade there. For a contract with a wide bid-ask spread, the difference can be meaningful.
That last point shapes everything below. Any profit-or-loss figure on an open position is an estimate. It is only as good as the price you valued it at, and any price you are reading outside of a live trading screen is already a little stale.
How to track it by hand
One row per open position. Record what you know for certain — direction, contracts, expiration, entry price — and refresh only the mark and the date you took it. Keeping an explicit "mark as of" date is the discipline that makes the sheet honest: it tells you whether the P/L column is from this morning or from last Tuesday.
Here is a three-position sheet. Entry and mark are per share, as options are quoted. Direction is Short if the position was opened for a credit, Long if it was opened for a debit.
Download the template: Open positions sheet (.xlsx). It opens in Excel, and in Google Sheets via File → Import. The worked example from this guide is already filled in, and the formulas carry down into the blank rows.
| Symbol | Position | Direction | Contracts | Expiration | Entry / share | Mark / share | Mark as of | Days to expiry | Unrealized P/L | % of entry captured |
|---|---|---|---|---|---|---|---|---|---|---|
| XYZ | 50 put | Short | 2 | 2026-02-20 | 1.5 | 0.6 | 2026-02-06 | 14 | 180 | 60.0% |
| ABC | 35 call | Long | 1 | 2026-03-20 | 2.4 | 1.9 | 2026-02-06 | 42 | -50 | -20.8% |
| DEF | 20 covered call | Short | 3 | 2026-02-13 | 0.5 | 0.7 | 2026-02-06 | 7 | -60 | -40.0% |
| Total | 70 |
Days to expiry
Subtract the mark-as-of date from the expiration date. XYZ expires 2026-02-20 and the marks were taken on 2026-02-06, so 14 days. ABC expires 2026-03-20: 42 days. DEF expires 2026-02-13: 7 days. Because the formula uses the as-of date rather than today, the whole row stays internally consistent — the DTE you see is the DTE that applied when you priced it.
Unrealized P/L
The arithmetic is the same for every row, with the sign flipped by direction: (entry − mark) × 100 × contracts for a short position, and the negative of that for a long one. The 100 is the contract size — the number of underlying shares one contract represents. Standard equity options use 100, but mini options use 10 and futures options use a broker-supplied multiplier, so check before you assume.
XYZ, short 2 puts. You collected 1.5 per share and it now marks at 0.6. The gap is 0.9 per share. Multiply by 100 shares and 2 contracts: 0.9 × 100 × 2 = 180. You took in 300 of premium at entry; the position has moved 180 of that in your favour, and 120 of value is still outstanding.
ABC, long 1 call. You paid 2.4 and it now marks at 1.9, so the raw gap is 0.5 in the short direction — but you are long, so the sign flips: −1 × 0.5 × 100 × 1 = −50. You paid 240 and the contract is currently valued at 190.
DEF, short 3 covered calls. You collected 0.5 and it now marks at 0.7, so the gap is −0.2 per share: −0.2 × 100 × 3 = −60. The call has gained value against you, which on a covered call usually means the stock has risen and the shares behind it are worth more. The option row alone does not tell the whole story.
Adding the three gives a total unrealized P/L of 180 − 50 − 60 = 70 across 3 positions.
% of entry captured
This column divides the row's unrealized P/L by the total entry value, entry × 100 × contracts. For XYZ: 180 ÷ (1.5 × 100 × 2) = 180 ÷ 300 = 0.6, or 60% of the premium captured. For ABC: −50 ÷ 240 = −0.208333, about −20.8% of the premium paid. For DEF: −60 ÷ 150 = −0.4, or −40%.
It is a progress bar, not a return figure. It says nothing about the capital tied up behind the trade, and for a short position it has no natural ceiling at 100% in the losing direction — DEF could keep going. Read it alongside DTE: 60% captured with 14 days left is a different decision from 60% captured with 60 days left.
The spreadsheet above already contains these three rows and the formulas, including the sign flip and the blank-row guards, so you can overwrite the example with your own positions.
Where manual tracking breaks down
The sheet works. It stops working for specific, nameable reasons.
- Rows that never get added. You open a trade on your phone during the day and do not type it in that evening. There is no cross-check, because the sheet has no idea what your broker thinks you hold.
- Partial fills. You enter three contracts; two fill at 0.52 and one at 0.48. The sheet has one row with one entry price, so your entry value is wrong by a small amount that compounds across the year.
- Rolls. You close the XYZ 50 put and open a 48 put further out, usually in one order for a net credit. Do you overwrite the row or add a new one? Overwrite and you lose the 180 you had already captured; add a row and the old one looks open forever. A roll chain — the linked sequence of positions created by rolling the same strategy over time — is exactly the thing a flat spreadsheet cannot represent.
- Assignments and expirations. A short put that is assigned does not vanish; it becomes shares at the strike. A leg that expires worthless needs closing out at zero. Neither event sends you a reminder, and an expired contract sitting in the open list quietly inflates your totals.
- Multi-leg positions. A vertical spread, calendar or iron condor is several legs with one economic result. One spreadsheet row cannot hold two expirations, and one row per leg loses the position.
- Multiple accounts. Separate tabs per account means no combined total; one tab means you cannot see a single account on its own.
- Stale marks. The most common failure of all. Re-pricing fifteen contracts by hand takes twenty minutes, so you do it weekly, and the P/L column is a week old when you look at it.
- Corrections. When you discover a mistyped strike from six weeks ago, every downstream total has to be rebuilt by hand.
How MetisTrades does it
MetisTrades builds the same list from your imported broker transactions, so the rows exist whether or not you remembered to type them. The Open Positions page is the working list of positions that still have open exposure. Anonymous visitors can use the page after uploading transactions into their browser session; Pro users get the signed-in portfolio version.
The summary and the table
Above the table, a portfolio summary shows Collateral Tied Up, Net Premium, Open Contracts and Strategies. When delayed option prices are available, the summary can also show portfolio Greeks. Below it, the table opens sorted by Expiration, ascending, so the nearest-dated positions sit at the top — the same scan order the hand-built sheet encourages.
Look at how each row carries the symbol, strategy, entry and expiration together with the profit-and-loss columns, and note that the expiration shown is a single date even for multi-leg positions.
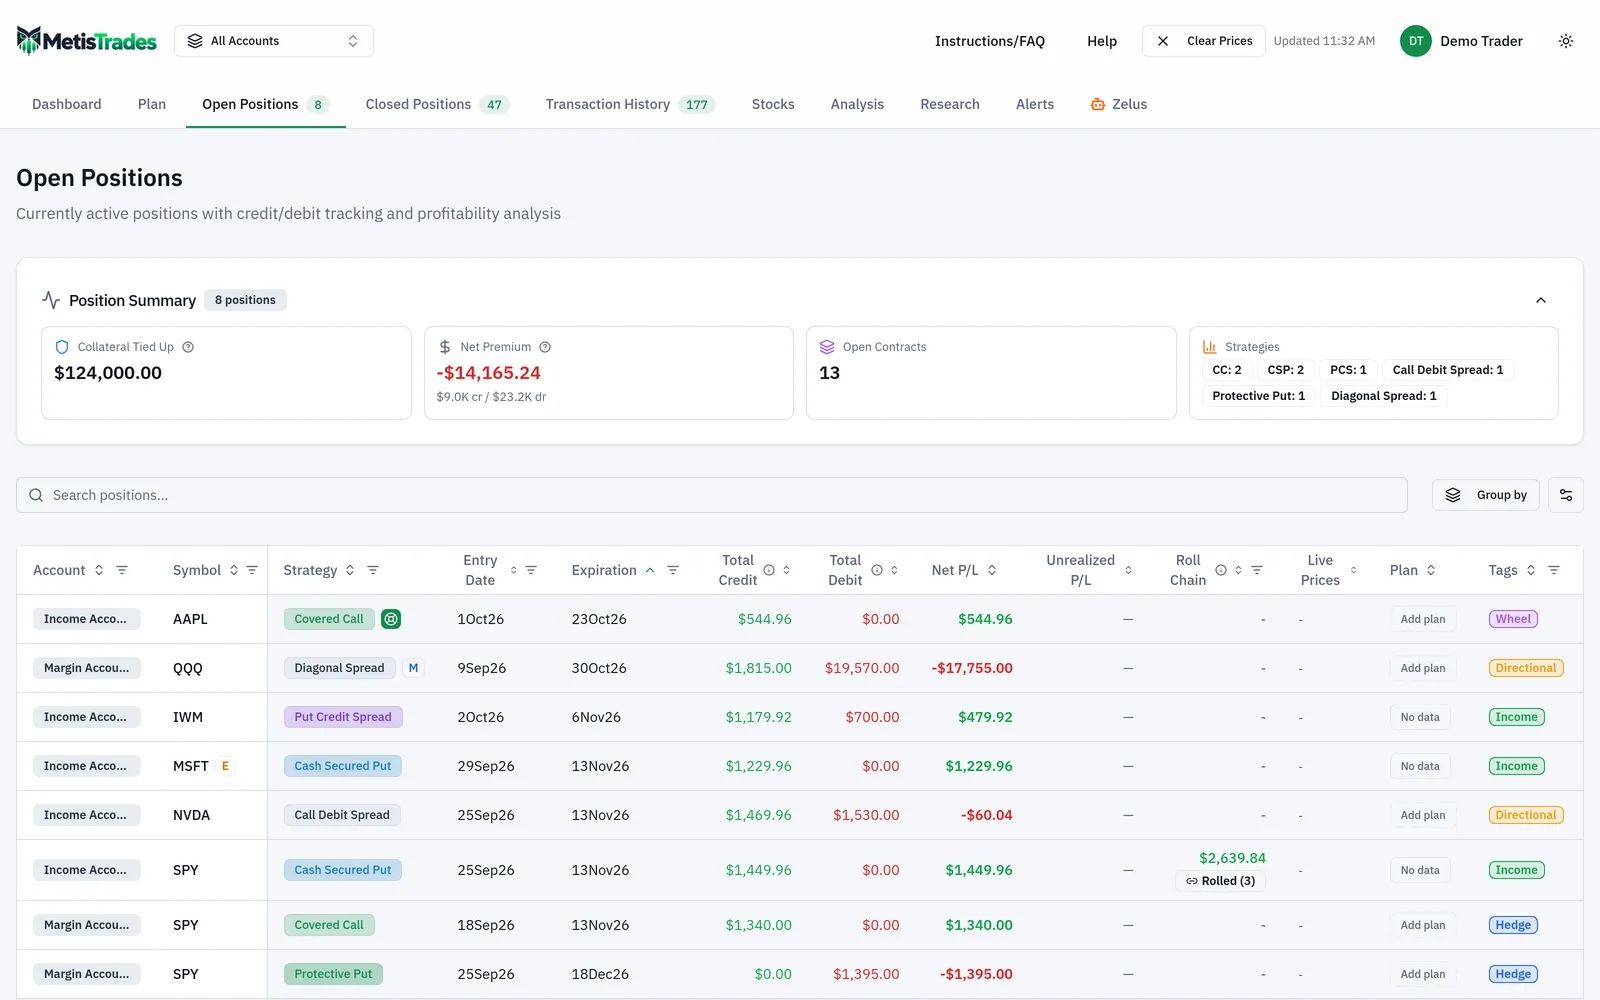
The standard column set includes Symbol, Strategy, Entry Date, Expiration, Total Credit, Total Debit, Net P/L, Unrealized P/L, Roll Chain, Live Prices, Tags, the Position Analyzer shortcut and Actions. When you are viewing all trading accounts, an Account column appears at the left.
Customize columns adds the fields the hand sheet had to compute, and several it did not: DTE, Days in Trade (DIT), Qty, Strike(s), % Return, P/L Gap, Extrinsic, BP at Open, Return on BP, Delta, Theta, Gamma, Vega, IV, BW Delta, Credit/Debit, OTM/ITM and Projected Price.
Fetching prices
Refresh Prices appears in the desktop site header when you have open positions or stock holdings and no cached prices; you must be signed in to use it. It fetches the latest available prices for open positions and stocks. The tooltip warns that quotes can be delayed by up to about 15 minutes, and when the market is closed you may be seeing the last available price. Once quotes are cached, the header shows Clear Prices and an Updated time — the app's equivalent of your "mark as of" column.
Until a usable quote has been fetched, Unrealized P/L, Greeks and other mark-derived fields do not render at all. A blank cell means no quote, not zero.
Narrowing the list
Use Search positions... to match a symbol or strategy. Filterable column headers carry a funnel control, with filters for Account (when viewing all accounts), Symbol, Strategy, Entry Date, Expiration, Credit/Debit, OTM/ITM, Roll Chain and Tags for your own signed-in portfolio. Clear All Filters resets the search and active filters. Group by nests the table by Trading Account, Symbol, Strategy, Entry Date, Expiration, Credit / Debit or Tag, with chips showing the nesting order and Expand all, Collapse all and Clear beside them.
If the table says No open positions found, clear the filters before concluding nothing was imported — the same message covers both cases.
Opening a row
Selecting a row opens the position details dialog. Option Legs lists calls before puts, higher strikes first, and each leg shows its transaction code, option type, strike, expiration, quantity, entry value and status. An open priced leg can add Current, vs Entry, per-leg unrealized P/L, the underlying Stock price, and bid, ask, mark, volume and open interest when supplied. The transaction timeline follows each leg from entry to its current state, and assigned or exercised legs add Assignment Details or Exercise Details with shares, strike price, FIFO Cost Basis and, for assigned calls, Stock P/L.
For a covered call like the DEF row in the example, a matching stock holding adds Underlying Stock Position with Shares Held, Cost Basis, Total Cost, Current Price and Stock P/L (All-Time), plus Covered Call Breakeven Analysis showing Contracts Covered, Premium/Share, Covered Breakeven and Portfolio Breakeven. That is the context the spreadsheet row was missing.
Expired legs
Nothing closes automatically. An amber Past due banner counts expired contracts still shown as open, and the Past due badge on a row opens the close modal for that position's expired legs only, with Expire Worthless pre-selected. Check the outcome against your broker statement before saving. If legs settled differently, uncheck the ones that did not share the chosen outcome, save, then reopen Past due on the refreshed row for the rest.
How to read the results
The table separates two P/L figures and the difference is the thing most worth understanding.
Net P/L is the transaction-derived result: credits received minus debits paid for this position segment, before fetched marks are applied to remaining exposure. On the XYZ row that would be the 300 collected at entry, with nothing paid back yet. It is a record of cash that has actually moved.
Unrealized P/L is the estimated mark-to-market result for open legs using fetched option marks — the 180 in the hand-built sheet. It is the same practical distinction MetisTrades describes as Standard P/L versus Live P/L: the standard figure reflects imported credits and debits, while the live figure estimates the result of closing open exposure at fetched marks.
Neither is realized. Realized P/L only exists once the position is closed or settled.
Other columns worth reading precisely:
- Expiration uses the nearest expiration among the open legs, and DTE counts days to that date. For a calendar or diagonal with two different expirations, the cell shows the nearer one — open the row to see every leg.
- % Return is unrealized P/L as a percentage of max profit for a credit position, or of cost for a debit position. That is not the same denominator as the hand sheet's "% of entry captured", so the two will not always agree.
- P/L Gap is the remaining profit potential: max profit minus unrealized P/L. On XYZ, with 180 of 300 captured, the gap is what is left to earn by holding.
- Extrinsic is the estimated time value remaining — the part of the option's price above its intrinsic value, which decays toward zero by expiration.
- BP at Open is buying power you enter yourself; the table does not supply it. Return on BP divides P/L by that entered figure, so it is only as good as what you typed.
- Roll Chain shows the cumulative result across linked rolled segments, not just the current row. If the chain figure differs from the row figure, that is why.
- Live Prices shows available bid, ask, mark, underlying price and per-leg Greeks. Futures contracts show N/A because live prices are not supported for them.
Here is the same table on a phone.
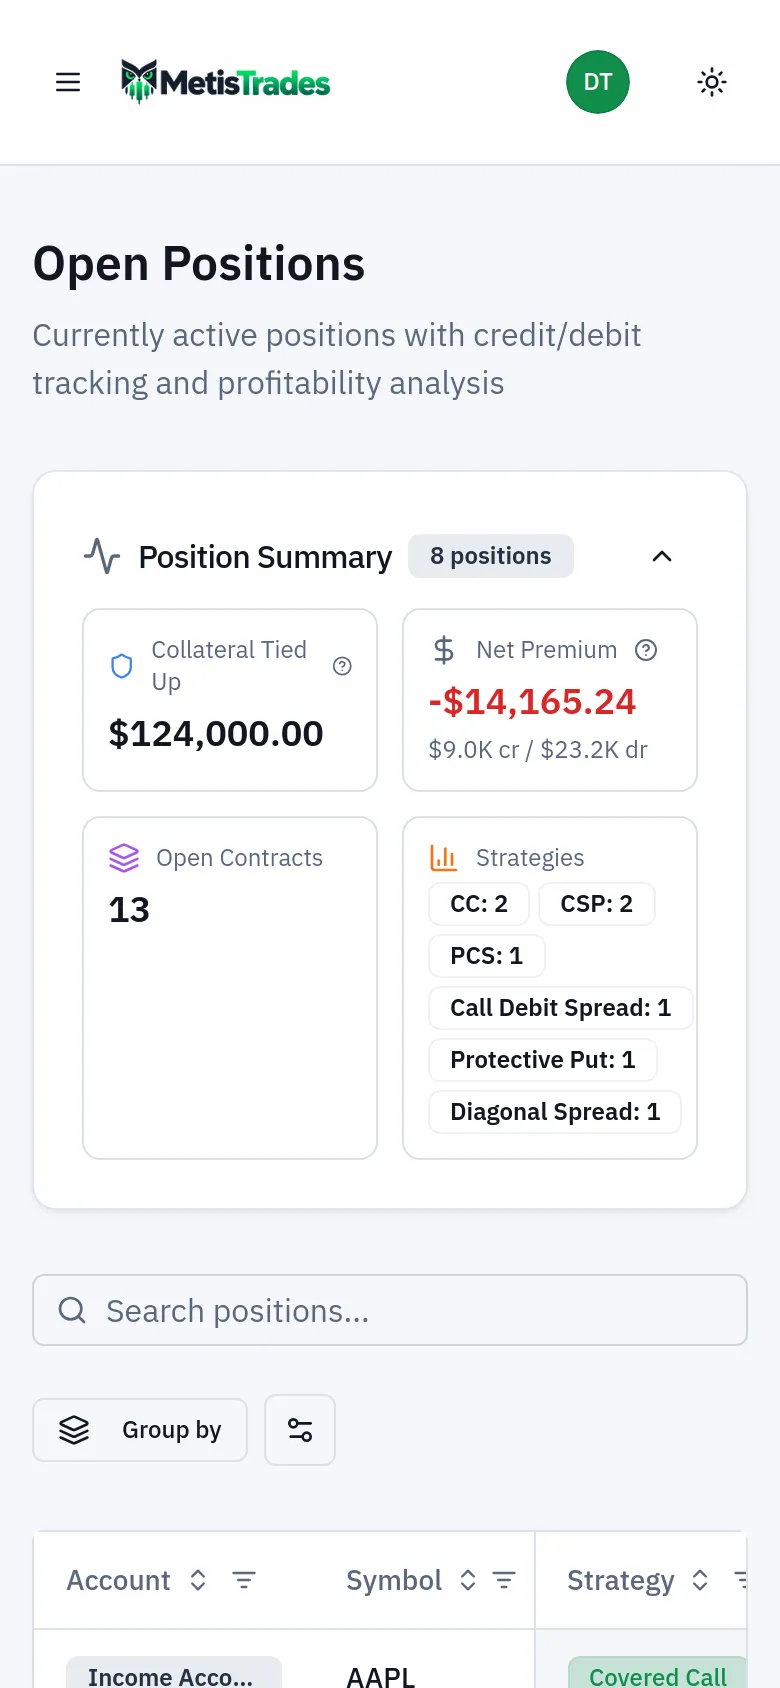
What none of these numbers mean: they are not executable prices. An option mark is not a guarantee that you can close at that price, especially with a wide bid-ask spread. Greeks are model estimates. And every grouping, P/L, cost-basis and return figure derived from imported transactions is an estimate — missing opening trades, transfers or assignments will change the result.
Common mistakes
- Treating unrealized P/L as money you have. It is a valuation at a delayed mark, not a settlement. Check the Updated time in the header before you act on it.
- Assuming every contract is 100 shares. Mini options use 10 and futures options use a broker-supplied multiplier. Confirm the multiplier before you multiply.
- Reading a spread's single expiration as the whole story. The cell shows the nearest expiration among open legs; open the row to see each leg's own date.
- Leaving expired legs sitting in the open list. Nothing closes automatically. Use Past due on the row, match the outcome to your broker statement, and save.
- Recording a roll as a brand-new trade. That hides the premium already captured on the earlier leg. Check Roll Chain for the cumulative result across linked segments.
- Concluding nothing imported when the table is empty. No open positions found also appears when a search or column filter removed every row — use Clear All Filters first.
- Judging a covered call by the option row alone. A short call losing value to the upside usually sits against shares that have gained. Open the detail panel for Underlying Stock Position and the breakeven figures.
Related guides and help pages
Related guides
- Replaying one options trade with Trade Backtest
- Plan, Track, Optimize: a complete tour of MetisTrades
- Understanding Roll Chains: Tracking a Rolled Option as One Trade
- Inside one position: legs, history and context
- Contract size and the 100-share multiplier
- The Greeks in practice: delta, theta, vega and gamma