Inside one position: legs, history and context
The Position details dialog gathers everything MetisTrades knows about a single position. Follow one rolled XYZ covered call through its summary, legs, timeline, stock context and roll chain, and learn what each figure means.
What it does and when to use it
Position details is the scrollable dialog that opens when you select a row on Open Positions or Closed Positions. A row gives you one line per position; the dialog gives you everything behind that line: the individual legs, the transactions that created them, the shares sitting underneath a stock-backed strategy, your notes and tags, and the roll chain the position belongs to.
A few words first, because the dialog uses them throughout.
- Leg — one stock or option part of a position. A single short call is one leg; a vertical spread has two.
- Mark — a single reference price used to value an option. MetisTrades uses it as the Current value of an open leg. Quotes are delayed, so a mark can lag the market and the price you actually trade at can differ.
- Unrealized P/L — the estimated gain or loss if the open leg were valued at its fetched mark.
- Premium P/L — the realized result attributable to the option premium on a completed leg.
- Roll chain — the linked sequence of positions created by rolling the same strategy forward over time.
Use the dialog when a row looks wrong or incomplete, when you want to see which leg is carrying the profit or loss in a spread, when you need to know what your shares cost before deciding whether to let a covered call go to assignment, or when you want the lifetime result of a trade you have rolled three times rather than just the current segment. It is a record-keeping and inspection view: it describes positions you already hold, and it does not recommend trades.
A worked scenario
You own 300 shares of XYZ bought at an average cost of $44.20. Six weeks ago you sold two XYZ calls at the $47.50 strike for $2.10 each. The stock rallied, you bought those calls back for $3.05 each and sold two $48.50 calls expiring in 45 days for $2.70 each. That is a roll, and the two positions form a roll chain.
Today XYZ is quoted at $46.80 and the $48.50 calls are marked at $1.15.
| Item | Figure |
|---|---|
| Shares held | 300 XYZ at $44.20 average cost |
| Closed segment (rolled from) | 2 short $47.50 calls, sold at $2.10, bought back at $3.05 |
| Open segment (current) | 2 short $48.50 calls, sold at $2.70, 45 days to expiration |
| Credit collected on the open segment | $540 (2 × 100 × $2.70) |
| Current mark on the short calls | $1.15 |
| Delayed stock quote | $46.80 |
The question the dialog answers: what is this position worth now, what did the roll cost, and how do the calls sit against the shares?
Step by step in MetisTrades
1. Fetch prices first
Several blocks in the dialog are conditional on usable quotes. Use Refresh Prices in the site header before you open the row; the cached values then feed both the row and the detail panel. Without a usable quote, per-leg unrealized P/L, per-leg Greeks, Position Greeks and other mark-based metrics do not render at all. That is deliberate — missing data is not treated as zero.
2. Open the position row
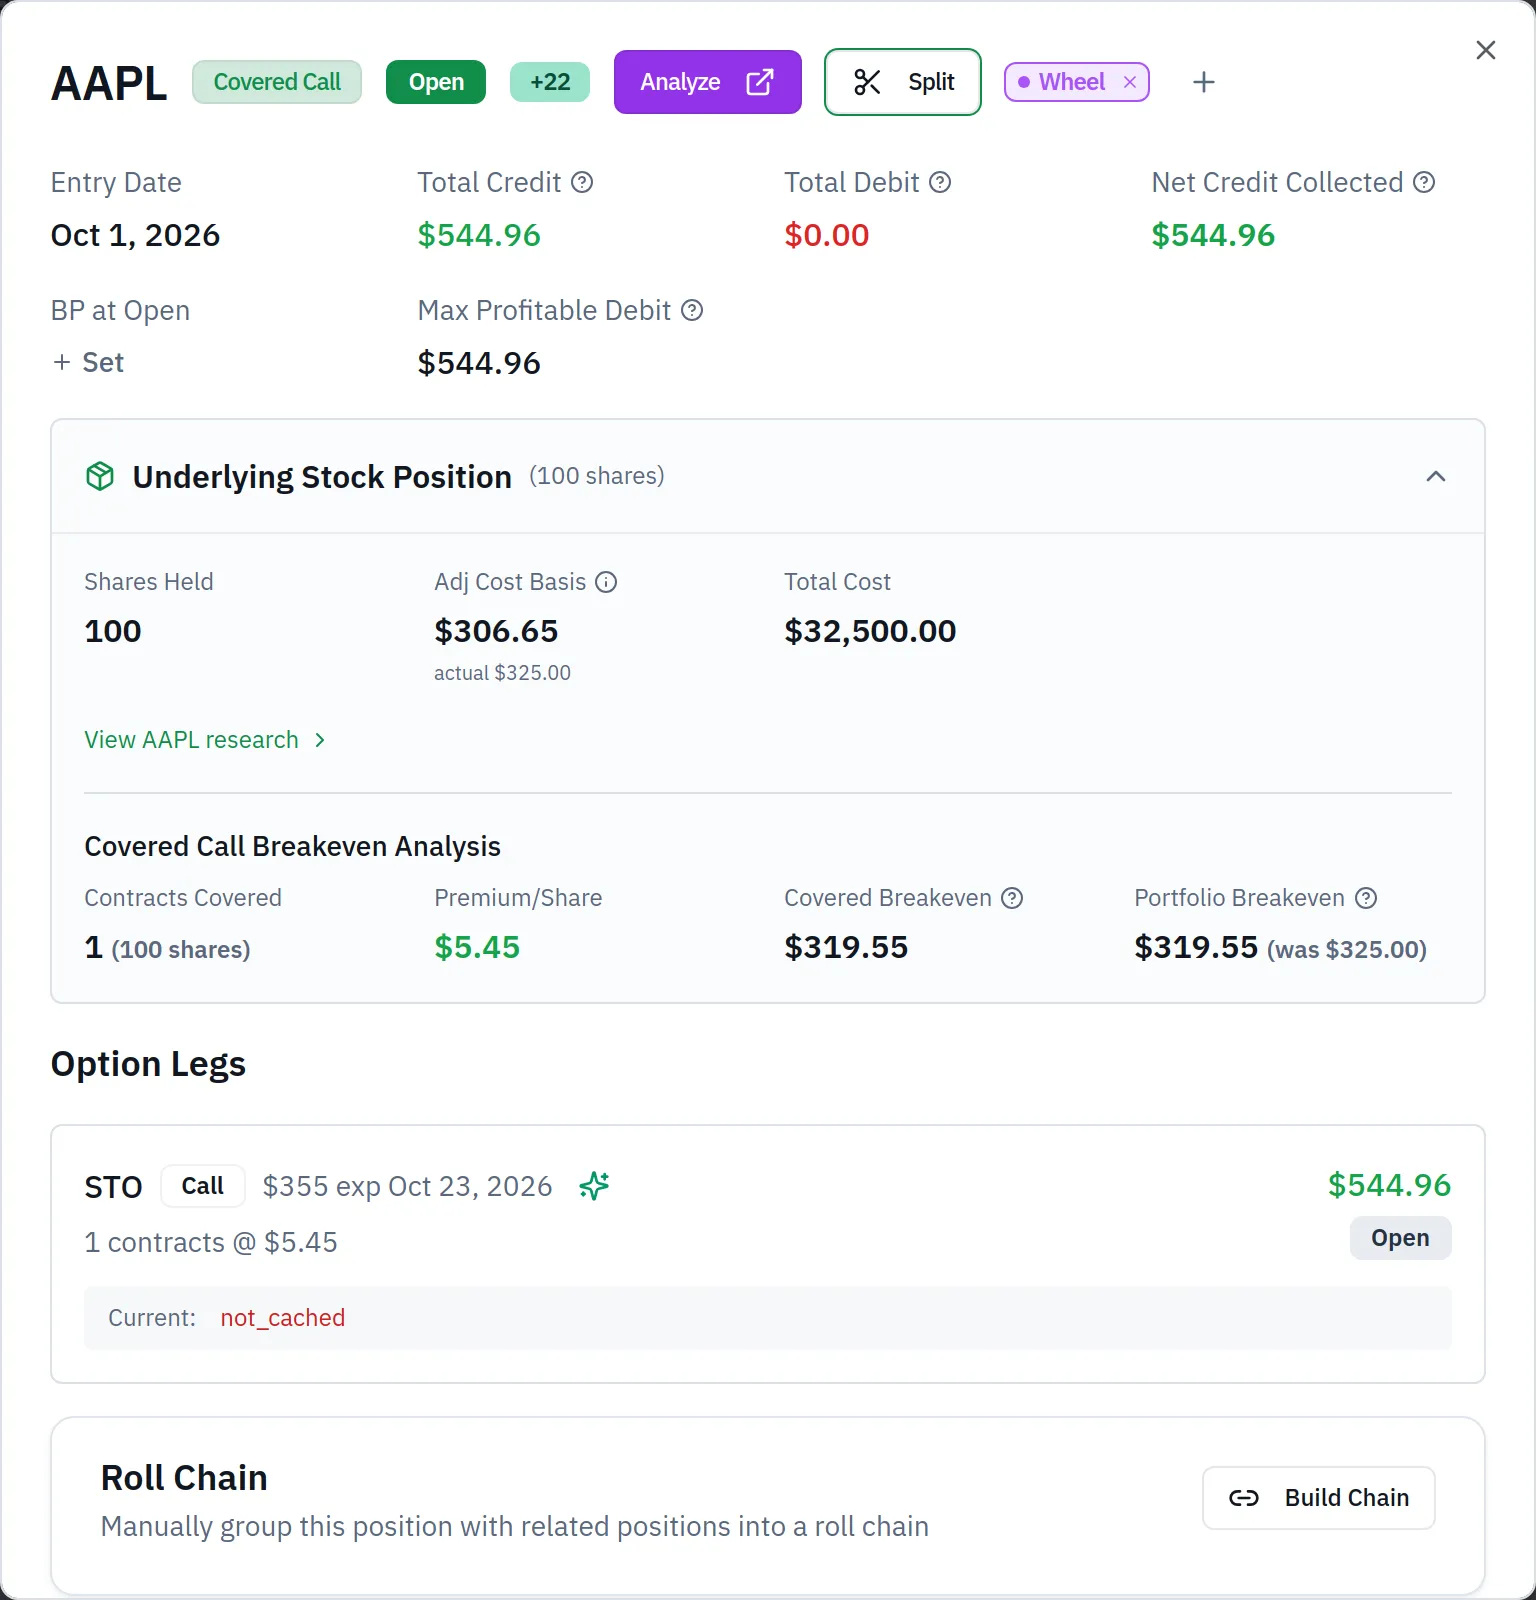
Go to Open Positions from the top nav and select the XYZ covered call row. While the selected row is being resolved, the dialog says Loading position details.... The screenshot below shows the opened dialog, with the header and summary at the top.
3. Read the header and summary
The header shows the symbol, the strategy, the status, and any manual-classification or grouping badges when they apply. The summary identifies Entry Date, Total Credit ($540 here), Total Debit ($0 on this segment), the applicable realized or unrealized P/L figures, and percentage return and remaining-profit figures when their inputs exist. A closed position also shows Exit Date.
Because this position is one segment of a chain, the panel warns that the top figures cover that segment only, and links to the chain total.
4. Check Position Greeks
Once usable prices are available, Position Greeks can show Delta, BW Delta, Gamma, Theta and Vega for the priced open legs. If each short call carries a delta of 0.29, the position delta is −0.29 × 2 × 100 = −58: the two short calls behave roughly like being short 58 shares of XYZ. BW Delta restates that exposure adjusted by the symbol's beta and underlying price relative to SPY.
5. Work through Option Legs
Option Legs lists calls before puts, with higher strikes first within each type. Each leg identifies its transaction code, option type, strike, expiration, quantity, entry value and status.
Entry price is the absolute imported leg amount divided by quantity and the contract multiplier: $540 ÷ 2 ÷ 100 = $2.70. An open priced leg also shows Current ($1.15), vs Entry (down $1.55 per share from $2.70), per-leg unrealized P/L of ($2.70 − $1.15) × 2 × 100 = $310, the underlying Stock price of $46.80, and bid, ask, mark, volume and open interest when supplied.
The per-leg Greeks line labels each figure in plain terms — Delta: Price change per $1 stock move, Gamma: Rate of Delta change, Theta: Daily time decay per contract, Vega: Price change per 1% IV move — along with implied volatility. For closed legs the card can show Closed and Premium P/L instead.
6. Follow the transaction timeline
The timeline shows opening and closing transaction codes, entry values, close dates, expiration, quantities and realized premium outcomes, so you can trace each leg from entry to its current state. On the closed $47.50 segment you can see the sale and the buy-back that made up the roll.
If a leg is assigned or exercised, the timeline adds Assignment Details or Exercise Details, which can include Shares, Strike Price, FIFO Cost Basis, Stock P/L for assigned calls, and Combined P/L (Premium + Stock) when available. A Partial indicator warns that only some assigned shares could be matched to known basis data; in that case Stock P/L covers only the shares with known basis.
7. Read the stock context
Supported stock-backed strategies with a matching holding add an Underlying Stock Position card. For this trade it can show Shares Held of 300, Cost Basis of $44.20, Total Cost of $13,260, Current Price of $46.80, and Stock P/L (All-Time) for the holding. View XYZ research opens the stock's research page.
For a covered call, Covered Call Breakeven Analysis adds Contracts Covered, Premium/Share, Covered Breakeven and Portfolio Breakeven. Read the values from the card rather than recalculating them in your head. For a protective put, Protective Put Analysis explains whether protection is active or on standby and can show protected shares, Premium Paid/Share, Protected Floor, Effective Breakeven, maximum risk, Protection Ends and combined share-and-put P/L when current prices are available.
8. Expand the roll chain
A linked chain with at least two positions shows Complete Roll Chain. Expand Roll Chain History to see the chain summary and its ordered segments. The summary can include Chain Total P/L, Realized P/L (Closed), Open Position P/L, lifetime credits and debits, current cost to close, and assignment outcome and net-if-closed-now figures when applicable. When delayed prices are included, the chain marks that its open-position calculation includes current prices.
If a position has roll records but is not yet in a chain, it shows Roll History and may offer Create Chain. A manually disconnected item instead shows Roll Chain controls for reconnecting its history. In your own signed-in portfolio you can use Edit Chain; a public share is read-only.
9. Add notes, tags and chart snapshots
Your signed-in portfolio can show assigned tag chips in the header, and Manage Tags attaches or removes them. The comments action from the table opens the notes panel; when the position belongs to a multi-segment chain, the panel gathers the chain positions in entry-date order and identifies the current one, so the reasoning behind the first sale sits next to the reasoning behind the roll.
Below the roll chain block, Chart snapshots keeps links to chart images with the position. It starts collapsed and the header shows how many are attached. Paste a link with an optional caption such as "Entry" or "Exit" and select Add. Accepted links are a TradingView snapshot link, a direct TradingView snapshot image on s3.tradingview.com, or a direct image on i.imgur.com; links must start with https://. A position can hold up to 20 snapshots, and the same link can be attached only once.
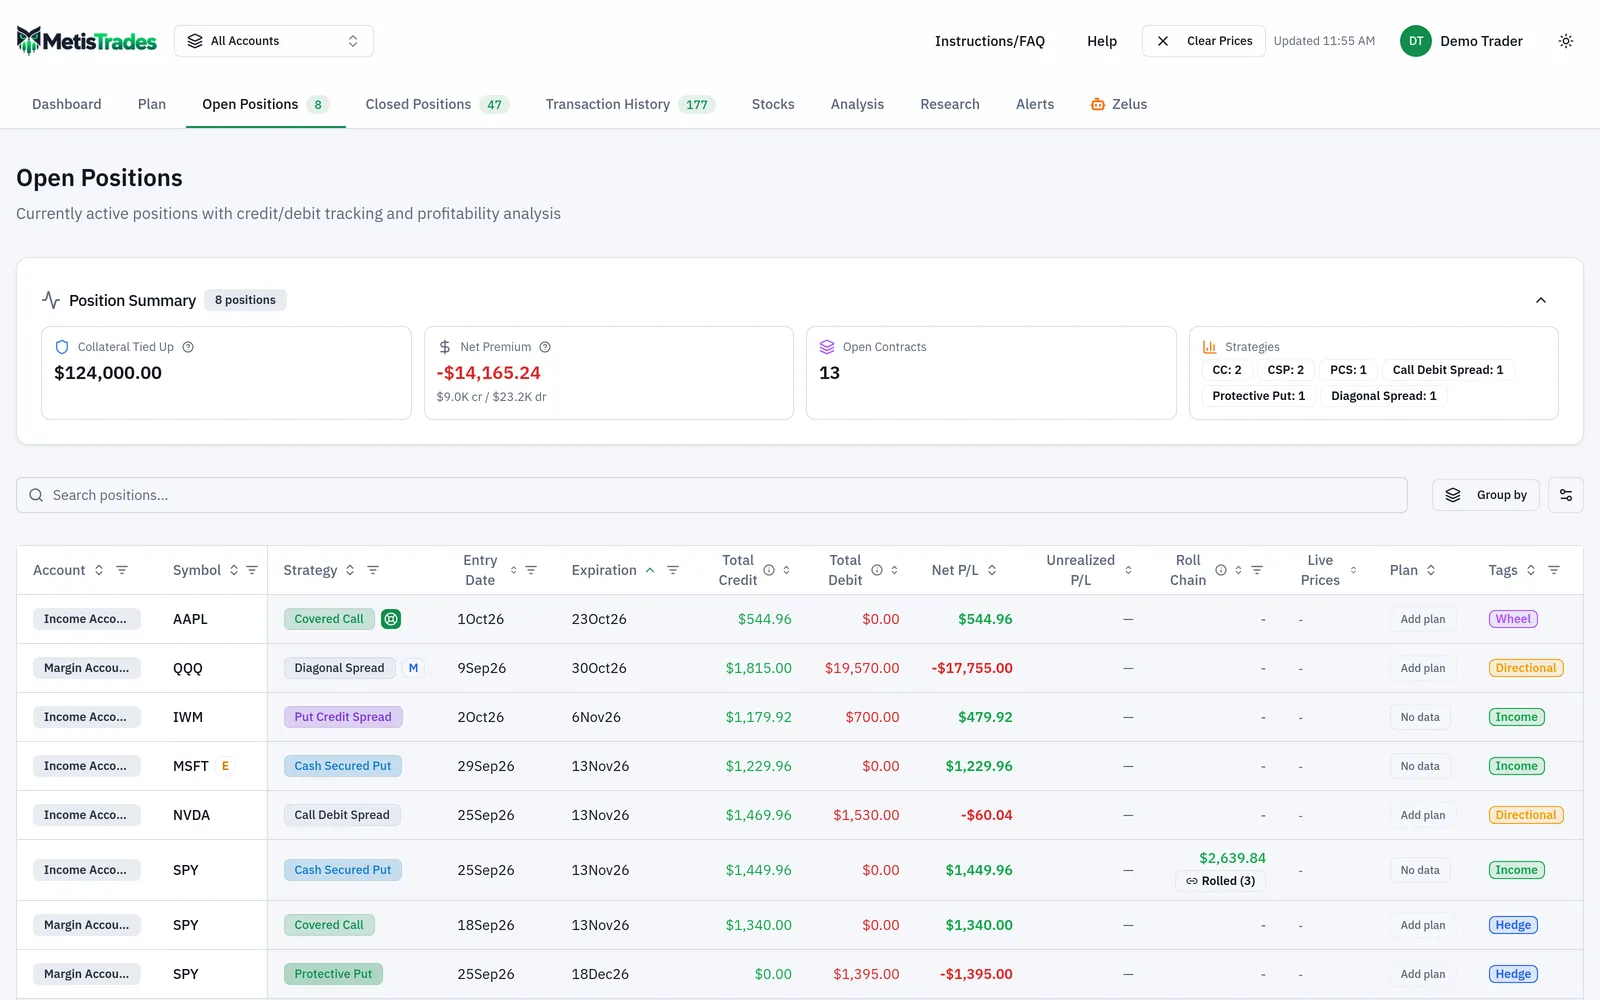
Every row behaves this way, so the same inspection is one click from any line in the table, as the next screenshot shows.
How to read the results
The top summary covers the selected segment only. For this XYZ position it reports $540 of credit, $0 of debit, and an unrealized figure of $310 based on the $1.15 mark. It does not tell you whether the trade as a whole has made money, because the $190 lost on the earlier $47.50 calls lives on the closed segment.
The chain summary is where the lifetime view appears. With lifetime credits of $960 ($420 plus $540), lifetime debits of $610, Realized P/L (Closed) of −$190, a current cost to close of $230 and Open Position P/L of $310, Chain Total P/L comes to $120: realized results from closed chain segments plus the applicable result for the open segment. That figure includes current delayed prices, and the chain says so when it does.
The per-leg numbers tell you where the result is coming from. A $310 unrealized gain on the calls alongside a positive Stock P/L (All-Time) on the shares are two separate things: the first is an estimate of what it would cost to close an open option leg at its fetched mark, the second is an all-time figure for the holding, not a result attributable to this options position.
Position Greeks describe sensitivity, not direction. A position delta of −58 says the short calls currently respond to a $1 move in XYZ roughly like 58 short shares; it says nothing about where XYZ will go, and it will change as the stock moves and time passes. Theta is an estimated daily decay figure, all else equal — and all else rarely stays equal.
Blank sections are information too. If Position Greeks or the per-leg unrealized block does not render, the required quote inputs have not been fetched. That is the dialog refusing to show a figure it cannot support, not a zero.
Limits and assumptions
Delayed quotes can lag the market by up to about 15 minutes. Marks are estimates, and the price at which an order actually fills can differ from the mark shown here.
Everything derived from imported transactions is an estimate: position matching, strategy classification, grouping, P/L, assignment handling, cost basis and return figures all depend on the activity your broker supplied. Missing opening trades, transfers or multipliers change the answer.
Greeks are model estimates based on available quote and contract inputs. Where a quote is missing, unrealized-derived fields are suppressed rather than filled with zero, which is why sections can appear and disappear between refreshes.
Transferred shares or incomplete transaction history can make cost basis partial or unavailable, which is what the Partial indicator on assignment details is telling you. Tax-related figures in the dialog are estimates from your imported transactions, not tax advice, and not a substitute for your broker's 1099-B.
Stock context appears only for supported stock-backed strategies with a matching holding and relevant share or realized-P/L data. Personal controls — Manage Tags, notes, editing roll chains, Chart snapshots and saved position changes — require your own signed-in portfolio and are hidden from public shares. Chart snapshots are also kept out of exports.
Common mistakes
- Reading the segment summary as the trade's lifetime result. When the panel warns that the figures cover that segment only, follow the link to Chain Total P/L.
- Treating a blank Greeks block as flat exposure. Close the dialog, use Refresh Prices in the site header, then reopen the row.
- Reading a mark as the price you would get. Check the bid and ask on the leg card as well, and remember the quote is delayed.
- Ignoring a Partial indicator on assignment details. It means Stock P/L covers only the matched shares; transferred shares or an incomplete transaction history are the usual causes.
- Adding Stock P/L (All-Time) to the option result and calling it the trade's return. Note which figure is an all-time holding result and which belongs to the option position before combining anything.
- Leaving a mis-grouped position as the dialog found it. Use the grouping, leg-split and strategy-override corrections so the legs, timeline and stock context describe the trade you actually placed.
- Writing a note on only one segment of a chain. The notes panel gathers chain positions in entry-date order, so record why you rolled on the segment you opened at the time.
Related guides and help pages
Related guides
- Contract size and the 100-share multiplier
- The Greeks in practice: delta, theta, vega and gamma
- Understanding Roll Chains: Tracking a Rolled Option as One Trade
- Keeping Track of Open Positions: Legs, Days to Expiry and Mark-to-Market P/L
- Replaying one options trade with Trade Backtest
- One Rolled Position, Two Ledgers: Chain P/L vs Tax-Year P/L