MFE and MAE explained: are you closing winners too early?
Max gain seen and max drawdown seen measure how far a closed trade ran for and against you while it was open. Work out capture, giveback and heat by hand from four real trades, then see where MetisTrades shows the same figures.
What it is and why it matters
Your realized profit or loss tells you what a trade booked. It cannot tell you what the trade was worth while it was still open. A short put that finished at +$28.96 might have been worth +$70.96 at some point, or might have been $44 under water a week earlier, and the realized number hides both.
Maximum favorable excursion (MFE), labelled max gain seen, is the best point a position reached while it was open. Maximum adverse excursion (MAE), labelled max drawdown seen, is the worst point. Both are measured on end-of-day closes: one profit-and-loss figure per trading day, from the day after entry to the day you closed.
Three readings follow from those two numbers:
- Capture % — realized P/L divided by max gain seen. 100% means you closed at the best daily close you ever saw. It is only a percentage for trades that closed at a gain.
- Giveback — max gain seen minus realized P/L, in dollars. It is the part of the best point you did not book.
- Heat — the max drawdown seen on trades that finished as winners. It is the discomfort you paid for the gain.
Two more terms appear alongside them. Days in profit / underwater counts the daily closes above and below zero after the entry day. Held to expiration continues the same daily path past your exit, settling each leg at intrinsic value on its expiration, and reports the difference against what you actually booked.
Why care? Because "I closed too early" and "I held too long" are claims about a path, and you cannot test either from a list of realized results. Measuring the path turns the argument into arithmetic. What it does not do is tell you which exit to use next time: every figure here is a historical measurement of one trade that already happened.
Work it out by hand
All four trades below are single-underlying cash-secured puts from a demo account. For a short option, the daily P/L is simple: the credit you received minus what it would cost to buy the contract back at that day's close, times 100 shares per contract, times the number of contracts.
Step 1: build the daily path (Trade A)
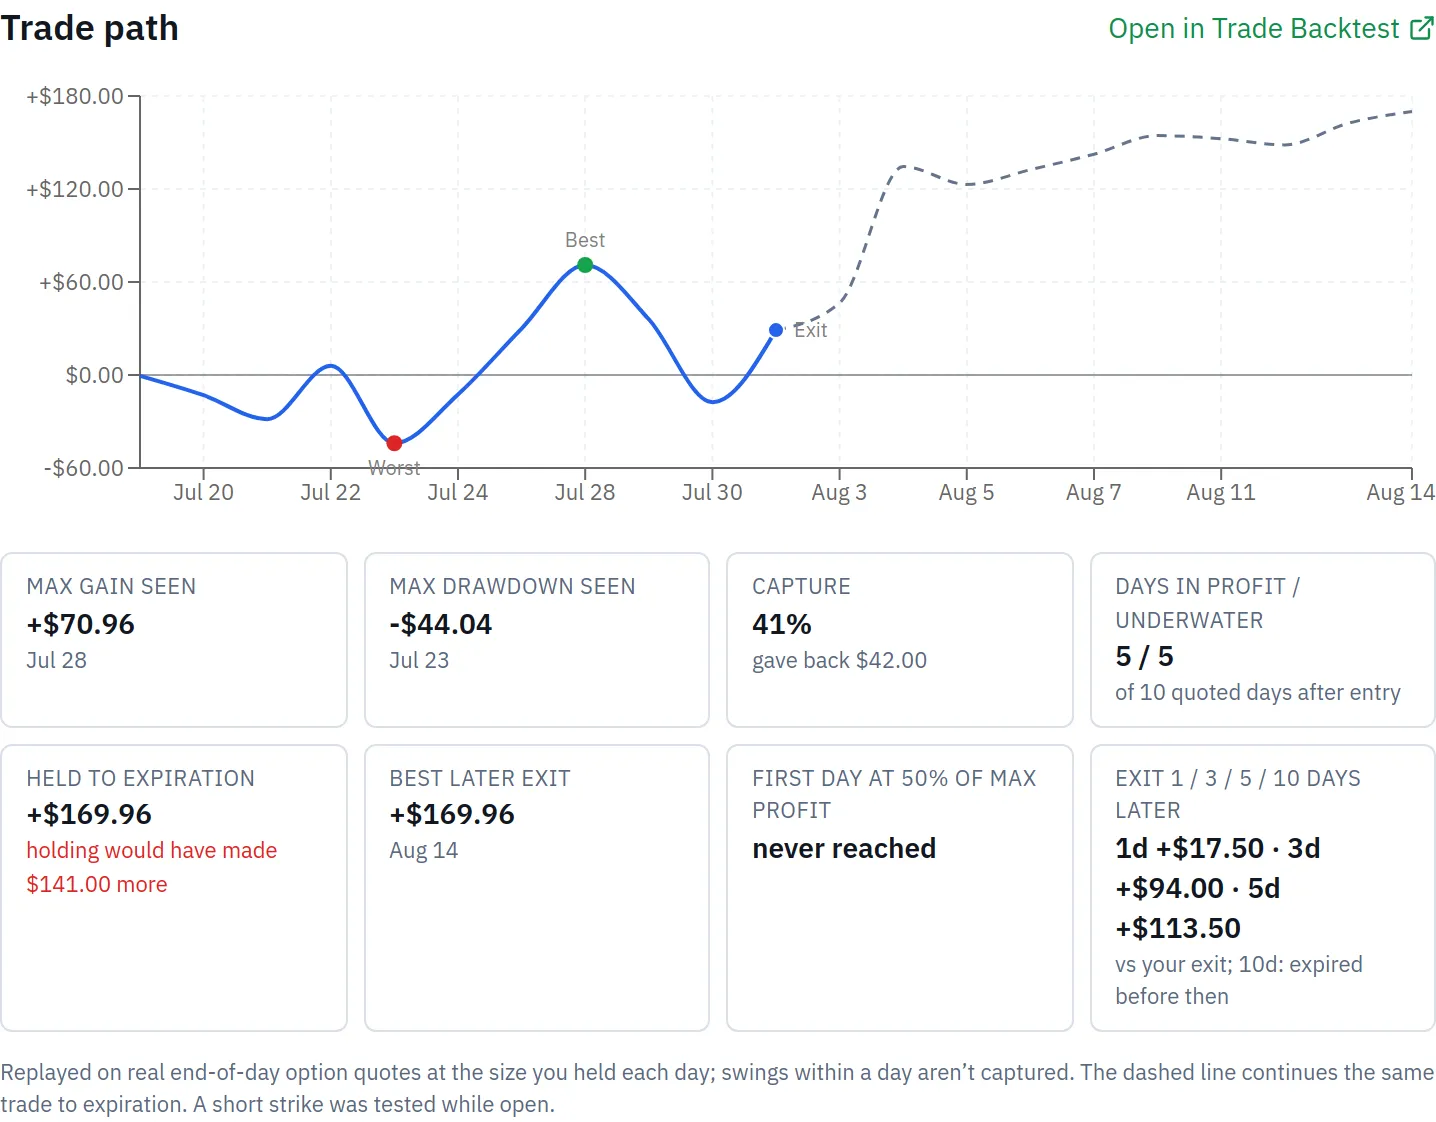
On 17 July 2026 you sold 1 PG 142 put expiring 14 August 2026 at $1.6996 a share. One contract is 100 shares, so the credit is 1.6996 × 100 = $169.96. On 31 July you bought it back at $1.41, a debit of 1.41 × 100 = $141.00. Realized P/L is 169.96 − 141.00 = +$28.96.
Now value the contract at every close in between. On 28 July the put closed at $0.99, so the path reads 169.96 − 99.00 = +$70.96. That is the best close of the trade: max gain seen. On 23 July it closed at $2.14, so the path reads 169.96 − 214.00 = −$44.04. That is the worst close: max drawdown seen. Over the ten quoted days after entry, five closes were above zero and five below.
Step 2: capture and giveback
Capture is 28.96 ÷ 70.96 = 0.408, which rounds to 41%. Giveback is 70.96 − 28.96 = $42.00. So you booked four dollars in ten of the best point this trade ever showed at a close.
Continue the same path past your exit. The put expired worthless, so holding every leg to expiration would have returned the full credit, +$169.96 — that is 169.96 − 28.96 = $141.00 more than your exit. The best later exit was the same +$169.96, on expiration day. Reading the continued path 1, 3 and 5 trading days after your exit gives +$17.50, +$94.00 and +$113.50 against what you booked; the 10-day point falls after expiration, so there is nothing to read.
One more line is worth noting. For a credit trade, maximum profit is the opening credit, so 50% of max profit here is $84.98. The path topped out at $70.96, so this trade never reached that line while it was open — a fact about the path, not a missed exit.
Step 3: when a gain turns into a loss (Trade B)
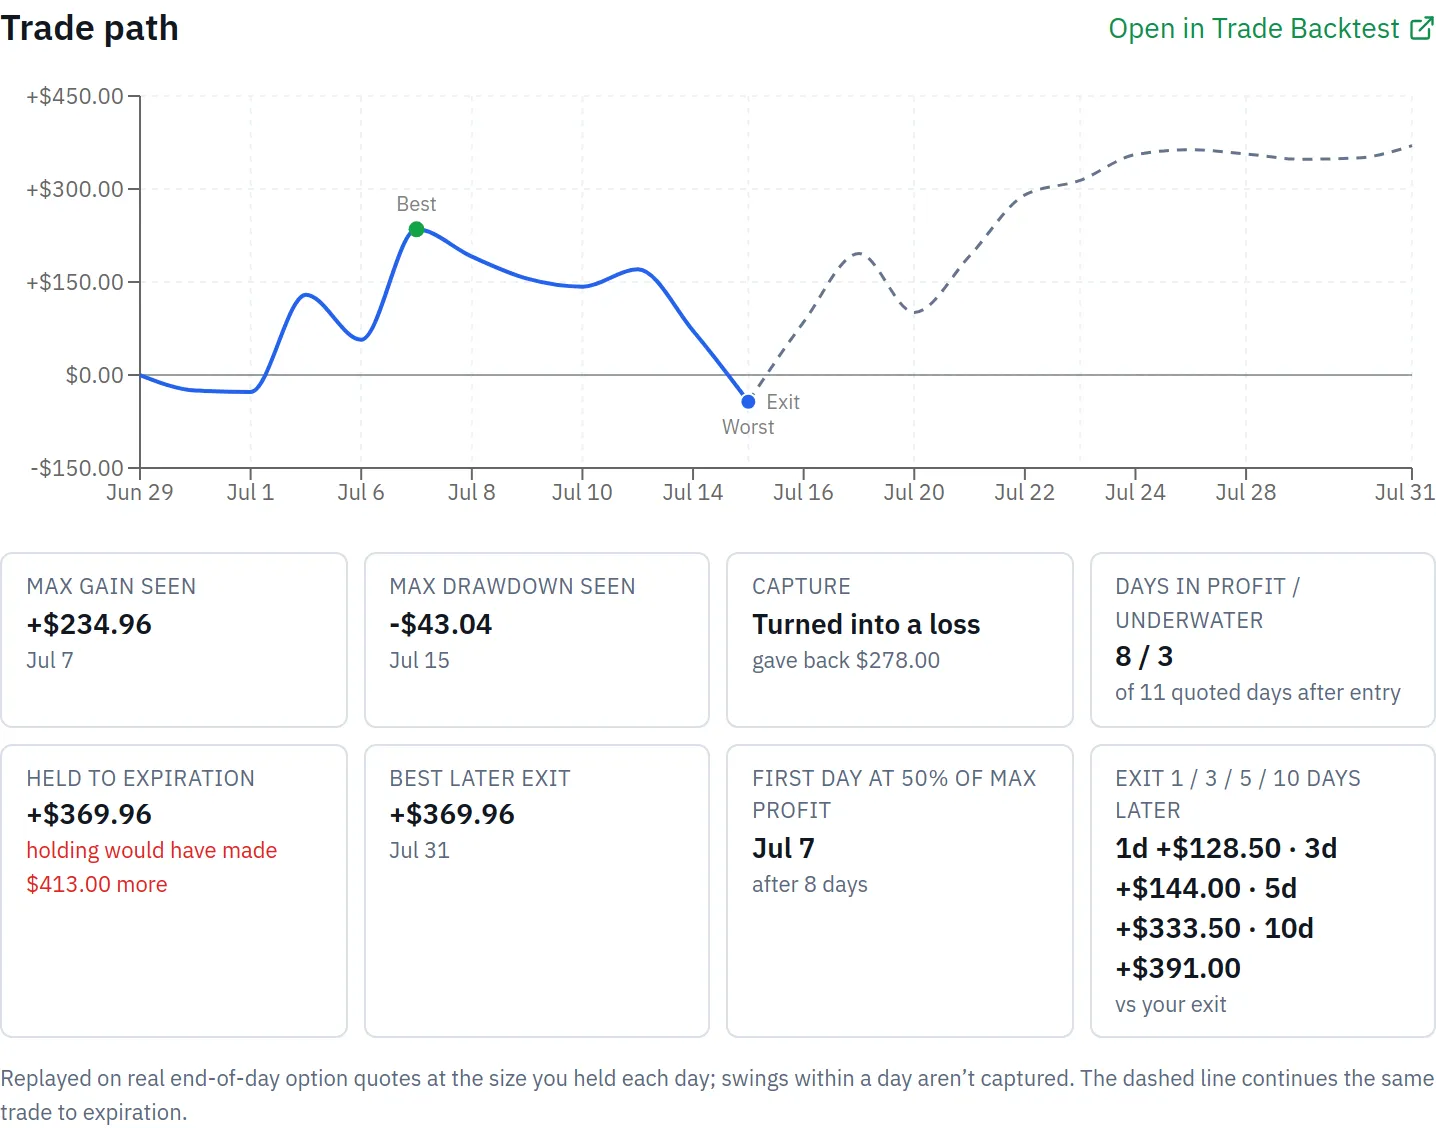
On 29 June 2026 you sold 1 JNJ 245 put expiring 31 July at $3.6996, a credit of $369.96. On 7 July the put closed at $1.35, so the path reads 369.96 − 135.00 = +$234.96. That cleared 50% of max profit ($184.98) eight days after entry. On 15 July you bought it back at $4.13, a debit of $413.00, so realized P/L is 369.96 − 413.00 = −$43.04.
Capture cannot be a percentage here: dividing a loss by a gain produces a number that means nothing. The reading is Turned into a loss. Giveback still works, because it is a subtraction: 234.96 − (−43.04) = $278.00. The exit day was also the worst close of the trade, so max drawdown seen is −$43.04. Eight closes were in profit, three under water, out of eleven quoted days.
Step 4: the counter-example (Trade C)
Trades A and B both would have done better held to expiration, and it is tempting to generalise. Don't. On 23 February 2026 you sold 2 PG 157.5 puts expiring 27 March at $1.3096, a credit of 1.3096 × 100 × 2 = $261.92. The best close was +$88.92 on 27 February; the worst was −$883.08 on 6 March. On 11 March you bought both back at $5.28, a debit of 5.28 × 100 × 2 = $1,056.00, realizing −$794.08.
Capture reads Turned into a loss, and giveback is 88.92 − (−794.08) = $883.00 — on the face of it, a terrible-looking trade. But continue the path: settled at intrinsic value on 27 March, the two puts would have cost $2,696.08 more than the credit, for −$2,696.08. Against that, your exit saved $1,902.00. A low capture number said nothing useful here; only the held-to-expiration line did.
Step 5: a trade closed at its best point (Trade D)
On 3 September 2026 you sold 1 SPY 742 put expiring 2 October at $2.8796, a credit of $287.96. On 10 September the put closed at $5.84, so the path reads 287.96 − 584.00 = −$296.04: more red than the whole credit. It recovered, reached 50% of max profit ($143.98) on 21 September, 18 days after entry, and you bought it back on 25 September for $0.28, a debit of $28.00. Realized is +$259.96, and that was also the best close of the trade, so capture is 259.96 ÷ 259.96 = 100% and giveback is $0.00.
Holding to expiration would still have added the last $28.00 of premium. And because this trade finished green, its max drawdown seen is heat: you sat through −$296.04 to book $259.96.
| Figure | Trade A (PG 142p ×1) | Trade B (JNJ 245p ×1) | Trade C (PG 157.5p ×2) | Trade D (SPY 742p ×1) |
|---|---|---|---|---|
| Credit received | $169.96 | $369.96 | $261.92 | $287.96 |
| Debit to close | $141.00 | $413.00 | $1,056.00 | $28.00 |
| Realized P/L | +$28.96 | −$43.04 | −$794.08 | +$259.96 |
| Max gain seen (MFE) | +$70.96 (28 Jul) | +$234.96 (7 Jul) | +$88.92 (27 Feb) | +$259.96 (25 Sep) |
| Max drawdown seen (MAE) | −$44.04 (23 Jul) | −$43.04 (15 Jul) | −$883.08 (6 Mar) | −$296.04 (10 Sep) |
| Capture | 41% | Turned into a loss | Turned into a loss | 100% |
| Giveback | $42.00 | $278.00 | $883.00 | $0.00 |
| Days in profit / underwater | 5 / 5 of 10 | 8 / 3 of 11 | — | — |
| First day at 50% of max profit | never while open | 7 Jul, day 8 | — | 21 Sep, day 18 |
| Held to expiration | +$169.96: $141.00 more | +$369.96: $413.00 more | −$2,696.08: exit saved $1,902.00 | +$287.96: $28.00 more |
What changes the outcome
Exit date. This is the only input you controlled. Move Trade A's exit three trading days later and the continued path is +$94.00 better than what you booked; five days later, +$113.50. Move it ten days and the offset falls after expiration, so there is nothing to compare. The expiration value would have been the same whatever you did, but a later exit would also have widened the window the best and worst closes are taken from, so max gain seen and max drawdown seen could change with it.
End-of-day versus intraday. Every point is a closing value. Trade A had a day whose low crossed the 142 strike, so the short strike was tested intraday, yet the worst close was only −$44.04. A trade that touched a bigger gain or loss inside a day shows only its closing values, so treat MFE and MAE as floors on the real excursion, not ceilings.
Position size. Trade C held two contracts. Halve it to one and the credit becomes $130.96, the best close +$44.46, the worst close −$441.54 and the realized result −$397.04. Capture and giveback percentages are unchanged, because size cancels in the ratio — but heat in dollars halves. Compare dollar heat only between trades of similar size.
Whether the trade ended green. Capture is realized ÷ max gain seen, which only means something when realized is positive. Trade B's +$234.96 best point and −$43.04 result produce Turned into a loss rather than a negative percentage. A trade that never showed a gain at any daily close reads n/a, and one that closed at exactly breakeven reads Closed flat.
Where the 50% line sits. For a credit trade the line is half the opening credit: $84.98 for Trade A, $184.98 for Trade B, $143.98 for Trade D. Sell a bigger credit and the line moves up, so the same dollar path can clear it on one trade and never reach it on another.
Fees and the fills on record. The daily path is priced from option quotes, while realized P/L comes from your recorded fills and what the broker took. The replay's final value has to agree with the journal within fees and a small rounding allowance; when it drifts further apart, the trade is marked as not reconciling and left out of averages rather than quietly dragging them around.
Assignment. The held-to-expiration what-if settles each leg at intrinsic value and ignores early assignment. A leg that was actually assigned is valued at its in-the-money price by the replay while the journal books the premium, which is exactly the kind of gap that makes a trade fail reconciliation.
Where you see it in MetisTrades
Start with one trade. Open Closed Positions, select the PG row, and scroll the position details dialog to the Trade path section (Pro). It draws the daily P/L line from entry to your exit, marks Best, Worst and Exit, and adds a dashed continuation from your exit to the last expiration. Look at the gap between the Best marker and the Exit marker — that is the $42.00 giveback you worked out by hand — and at the stat row underneath, which carries max gain seen, max drawdown seen, Capture, days in profit / underwater, Held to expiration, Best later exit, first day at 50% of max profit, and the exit 1 / 3 / 5 / 10 days later comparisons.
The JNJ trade shows the other reading. Its line is well above zero at the 7 July close and finishes below zero on the exit day, so Capture cannot be a percentage. Look at the wording in the Capture stat and the gave-back amount beside it.
Open in Trade Backtest at the bottom of the section opens the same replay — your real fills, part-closes and exit, at the size you held each day — which is also what the position's Backtest button runs.
One trade is an anecdote. Analysis → Trade Path (Pro) plots every measured closed trade at once. The first chart puts max gain seen across and realized P/L up, with shaded zones for good: kept a gain, bad: gain turned into a loss and watch: never worked. Dots near the diagonal kept most of their best point; Trade B sits in the lower band. Selecting a dot opens that position.
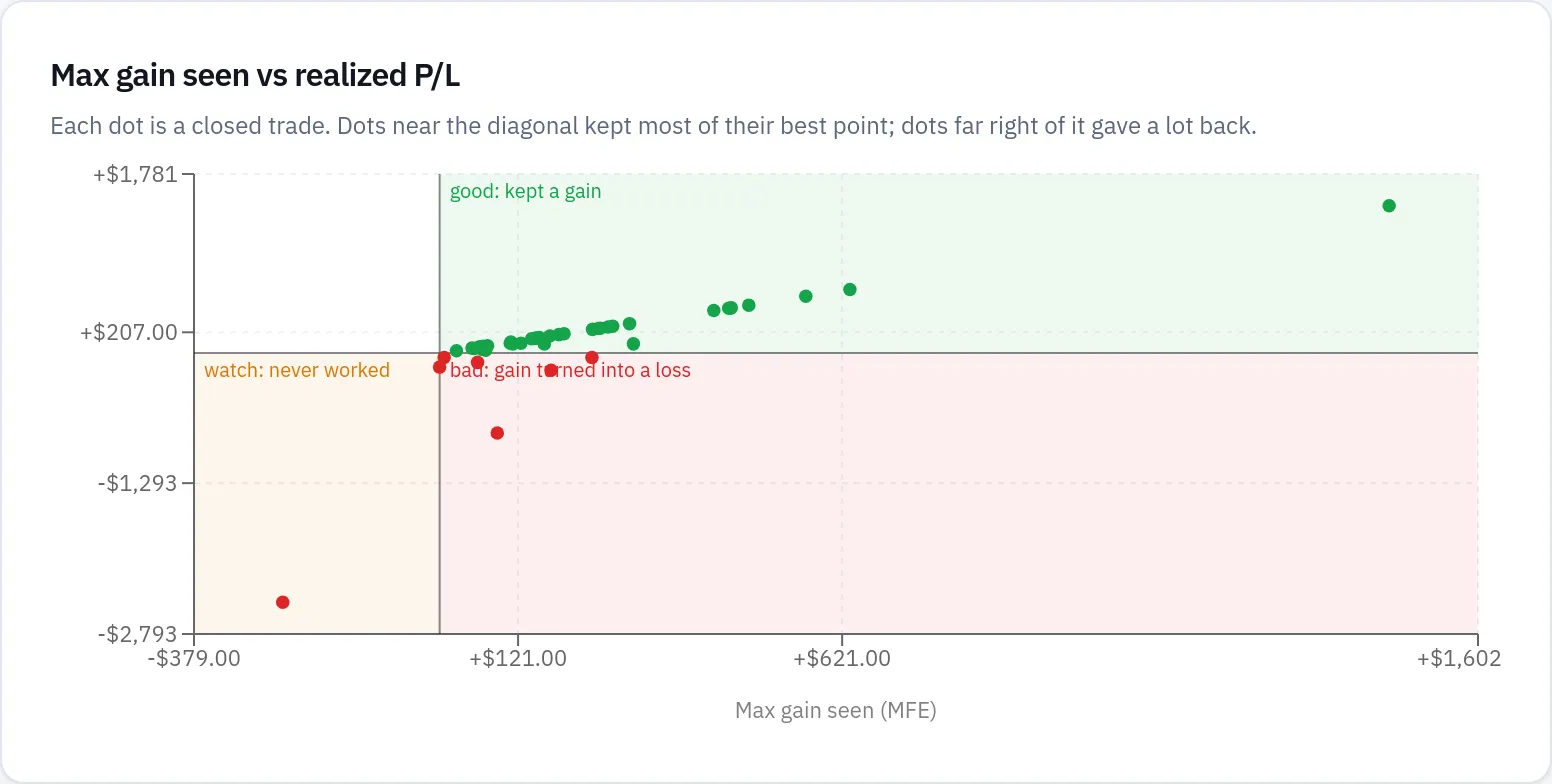
Below it, a second scatter does the same with max drawdown seen, and a Held-to-expiration Δ histogram shows, for trades whose last expiration has passed, what holding would have made minus what your exit made. Right of zero means holding would have paid more. The What the paths say readouts turn the charts into sentences. For the demo Income Account over All Time they read: "Across 35 winners you exited 8% below the best point on average (capture 92%)", "Your winners sat through −$60.90 at their worst daily close on average", "74% of your credit trades reached 50% of max profit, after 9 days on average", "Holding to expiration would have beaten 26 of 29 early exits (average Δ +$8.67 across all settled trades)" and "A short strike was tested on 9 of 42 trades with short legs".
Read that fourth line carefully. Holding beat 26 of 29 early exits, yet the average Δ is only +$8.67, because the average is taken over every settled trade and a few exits saved a great deal — Trade C alone saved $1,902.00. A majority and an average can point in opposite directions.
The coverage footer counts what was left out: here it reads Measured 42 of 46 trades, with one trade the data vendor has no history for and three that don't reconcile with the journal. In this scenario the first is an AMD put, and each of the three had a leg assigned (the journal books the premium while the replay values the option at its in-the-money price). Those four appear in no chart and no average. The period picker selects trades by exit date, and while measuring runs you see Measuring trades… N of M; when the daily allowance is used up, the rest continue tomorrow. The Trade Path sub-tab never appears on a public share link.
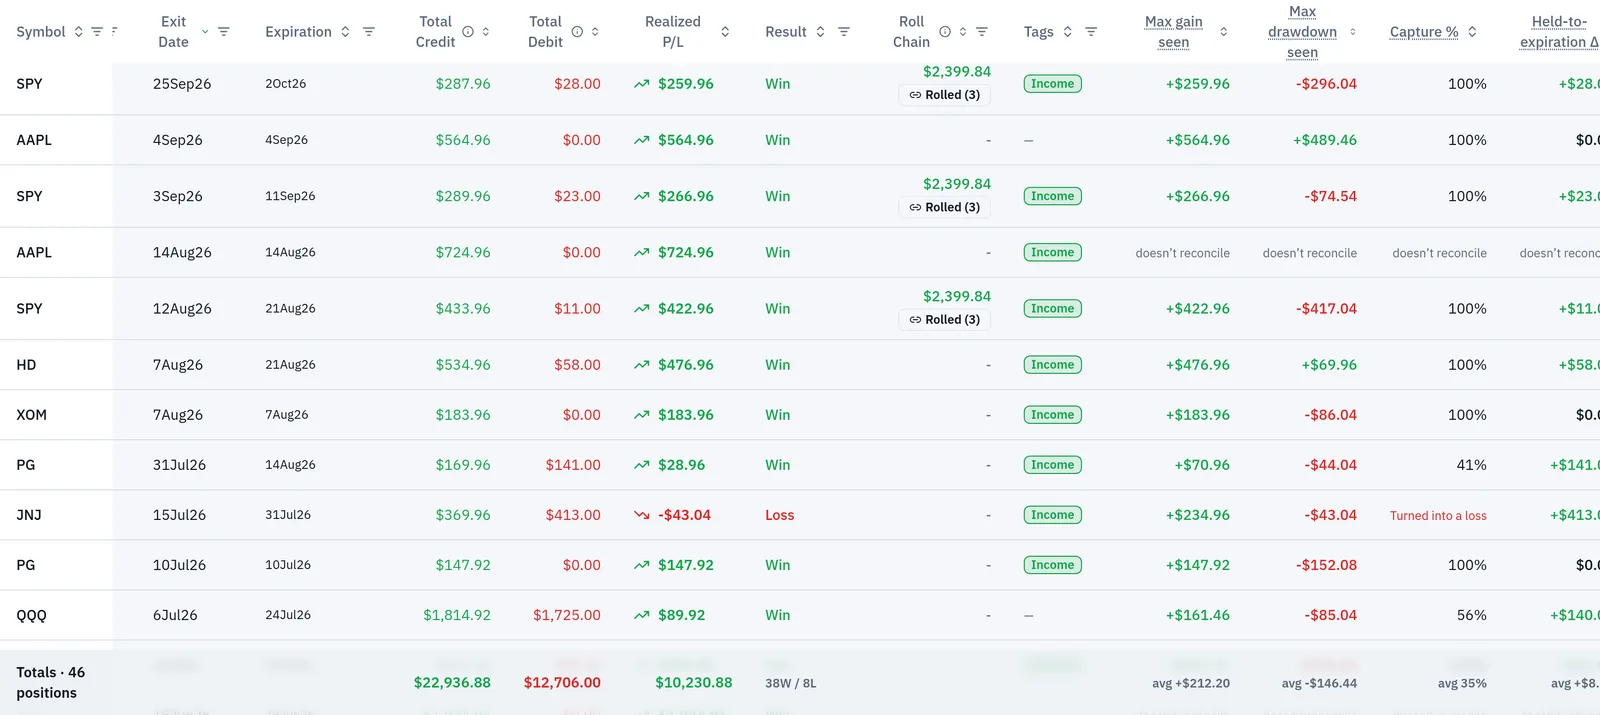
Finally, the same four figures can live in the table. In Closed Positions, turn on Max gain seen, Max drawdown seen, Capture % and Held-to-expiration Δ in the column settings (Pro). Each column sorts, so you can rank by max gain seen, by drawdown, or by the trades where holding would have paid most; the totals row averages each column over measured trades. Cells that cannot show a number say why — computing…, continues tomorrow, retrying later, not measurable, doesn't reconcile or once fully closed.
Common mistakes
- Treating a low capture % as proof you closed too early. Trade C's exit saved $1,902.00 and still shows no capture percentage — read the held-to-expiration line for each trade before drawing a conclusion.
- Reading max gain seen as a price you could have filled. It is one end-of-day close valued from that day's option quotes, not an executable fill; the market you faced that afternoon may have been wider.
- Assuming the worst point is the worst thing that happened. Only closes are recorded. Trade A's day low crossed the 142 strike while its worst close was only −$44.04.
- Comparing dollar heat across different sizes. Trade C's −$883.08 is two contracts; halve the size and it is −$441.54. Compare per contract, or compare percentages.
- Trusting an average without reading the coverage footer. Four of the 46 demo trades were excluded; check what was measured before quoting a portfolio-wide figure.
- Expecting a roll chain to be measured as one trade. Each position in a chain is replayed on its own, so a chain's capture is not the sum of its segments.
- Turning any of this into a rule. These are measurements of trades that already happened; they do not show what a different exit would do next time, and options carry risk of loss either way.
Related guides and help pages
Related guides
- Plan, Track, Optimize: a complete tour of MetisTrades
- Trade Path: how far each closed trade ran for and against you
- Analyzing closed-trade performance: win rate, expectancy and profit factor
- Win Rate Is Not Enough: Expectancy and Profit Factor
- Premium, Credits and Debits: How Option P/L Is Counted
- Contract size and the 100-share multiplier