Premium, Credits and Debits: How Option P/L Is Counted
Selling an option opens with a credit, buying opens with a debit, and the two sides of a trade combine into realized profit or loss. Work through a four-fill example by hand, then see where the same figures appear in MetisTrades.

What it is and why it matters
Premium is the price of an option contract. It is quoted per share of the underlying, not per contract. An option priced at 1.50 does not cost $1.50; it costs 1.50 multiplied by the number of shares the contract represents.
That multiplier is the contract size. A standard equity option usually represents 100 shares, so a 1.50 premium is $150 of cash for one contract. Mini options represent 10 shares, and futures options use a multiplier supplied by the broker, so the size is not always 100. Check it before you multiply.
Every fill moves cash in one of two directions:
- A credit is money you collect when you open or adjust a trade. Selling an option produces a credit, because the buyer pays you for taking on the obligation.
- A debit is money you pay. Buying an option produces a debit, because you are paying for a right: the right to buy the underlying at the strike (a call) or to sell it at the strike (a put).
The strike is the fixed price at which the contract can be exercised. The direction of the first fill — credit or debit — is a description of the cash, not a forecast. A position opened for a credit can still end as a loss, and a position opened for a debit can still end as a gain. The example below contains one of each.
Profit or loss only becomes final when the exposure is gone. Realized P/L is profit or loss from activity that has been closed or settled: the opening cash plus the closing cash, net of fees. Until then you hold an open position whose eventual cash is unknown. MetisTrades keeps those two states apart. Standard P/L is based only on the credits received and debits paid so far, without adding any market value for still-open legs. Live P/L marks open legs against the latest available fetched prices, which are delayed.
Why learn the arithmetic rather than reading a number off a screen? Because the number on the screen is built from your imported transactions. If a fill is missing, if the multiplier is wrong, or if fees were never imported, the figure quietly changes. Knowing what the total should be is how you notice.
Work it out by hand
The job is a cash log: one row per fill, each row signed, with a running total per position. Nothing else is needed. The rule for a single row is:
Leg cash = premium x contracts x 100, signed (+ for Sell, - for Buy), minus fees
The companion spreadsheet holds this example and its formulas, so you can change a price or a contract count and watch the totals move.
Download the template: Option cash log spreadsheet (.xlsx). It opens in Excel, and in Google Sheets via File → Import. The worked example from this guide is already filled in, and the formulas carry down into the blank rows.
The four fills
Two positions in the same underlying, each opened and closed. The first is a short put opened for a credit. The second is a long call opened for a debit.
| Date | Position | Action | Side | Contracts | Price / share | Fees | Leg cash | Position cash to date |
|---|---|---|---|---|---|---|---|---|
| 2026-01-05 | XYZ 50 put (short) | Sell to open | Sell | 2 | 1.50 | 1.30 | 298.70 | 298.70 |
| 2026-01-26 | XYZ 50 put (short) | Buy to close | Buy | 2 | 0.40 | 1.30 | -81.30 | 217.40 |
| 2026-02-02 | XYZ 55 call (long) | Buy to open | Buy | 1 | 2.20 | 0.65 | -220.65 | -220.65 |
| 2026-02-20 | XYZ 55 call (long) | Sell to close | Sell | 1 | 3.10 | 0.65 | 309.35 | 88.70 |
Row one: the opening credit
You sell two XYZ 50 puts at 1.50. The premium per contract is 1.50 x 100 = $150, and there are two contracts, so $300 arrives. Fees of 1.30 come out of it: 300 - 1.30 = 298.70. The side is Sell, so the sign is positive. Position cash to date is 298.70, because this is the position's first row.
That 298.70 is not profit. It is cash you hold while owing an obligation: if the puts are assigned, you buy 200 shares at 50. The obligation has to be settled before the result is known.
Row two: closing the short
Three weeks later the puts trade at 0.40 and you buy them back. 0.40 x 2 x 100 = $80 leaves your account, plus 1.30 of fees: -(80) - 1.30 = -81.30. The side is Buy, so the sign is negative.
Position cash to date is now 298.70 - 81.30 = 217.40. The exposure is gone, so that running figure is the position's realized result. You collected 300 of premium, paid 80 to be released from the obligation, and paid 2.60 in fees across both fills.
Row three: the opening debit
A new position. You buy one XYZ 55 call at 2.20, so 2.20 x 1 x 100 = $220 leaves your account, plus 0.65 of fees: -(220) - 0.65 = -220.65. Position cash to date is -220.65, because this position's running total starts here. The short put rows do not touch it; the running total matches on the position label.
The most you can lose on this leg is already known: the 220.65 you paid. The most you can gain is not known, because it depends on where the underlying goes.
Row four: closing the long
You sell the call to close at 3.10. 3.10 x 1 x 100 = $310 arrives, less 0.65 of fees: 310 - 0.65 = 309.35, positive because the side is Sell. Selling to close a long is a credit; it does not open a short. The running total is -220.65 + 309.35 = 88.70.
The totals
| Total | Amount | How it is built |
|---|---|---|
| Credits received | 608.05 | 298.70 + 309.35 |
| Debits paid | -301.95 | -81.30 + -220.65 |
| Total fees | 3.90 | 1.30 + 1.30 + 0.65 + 0.65 |
| Net realized P/L | 306.10 | 608.05 - 301.95 |
Two cross-checks confirm the result. Adding the final running totals of the two positions gives 217.40 + 88.70 = 306.10. Working from gross premium gives the same answer a different way: 300 + 310 = $610 collected, 80 + 220 = $300 paid, leaving 310 before costs, then 310 - 3.90 = 306.10.
Note what the fee column is doing. The fills cover 2 + 2 + 1 + 1 = 6 contracts and total fees are 3.90, which is 0.65 per contract. Fees here are 1.3% of the net result, small but not nothing, and they get charged on the way in and on the way out.
What changes the outcome
Each change below alters one number in the example and leaves everything else alone.
The closing price
Change the buy-to-close on the short put from 0.40 to 0.90. Leg cash becomes -(0.90 x 2 x 100) - 1.30 = -181.30, and the position's realized result falls from 217.40 to 298.70 - 181.30 = 117.40. Net realized P/L across both positions drops from 306.10 to 206.10. Nothing about the opening credit changed; the entire difference is what you paid to get out.
Letting it expire instead of closing
If the short put expires with no closing fill, there is no row two. Position cash to date stays at 298.70 and net realized P/L becomes 298.70 + 88.70 = 387.40. Expiration, assignment or exercise can end a position just as a closing trade does. Assignment is not free, though: a short put assignment normally buys the shares at the strike, which starts a stock position with its own cost basis.
The direction of the underlying
Price, time remaining and implied volatility do not appear anywhere in the arithmetic. They act on exactly one input: the price you close at. Change the long call's closing fill from 3.10 to 0.10 and leg cash becomes (0.10 x 100) - 0.65 = 9.35, so the position ends at -220.65 + 9.35 = -211.30. Net realized P/L across both positions collapses to 217.40 - 211.30 = 6.10. The debit-opened position was a gain of 88.70 in the first version and a loss of 211.30 in this one, from a single price.
Contract count
Sell 4 puts instead of 2 at the same 1.50 and the opening credit becomes (1.50 x 4 x 100) - 2.60 = 597.40, using the same 0.65 per contract. Size scales the gains and the losses together, and it scales the fees too.
Contract size
If those contracts represented 10 shares instead of 100, the opening fill is 1.50 x 2 x 10 = 30, less 1.30 of fees, for 28.70 — about a tenth of the figure in the table. The multiplier is the single easiest thing to get wrong by a factor of ten.
Fees
Double the per-contract fee to 1.30 and total fees rise from 3.90 to 7.80, taking net realized P/L to 302.20. On a six-contract example that is minor. On a strategy that opens and closes dozens of contracts a month, the same per-contract figure compounds into a real drag, which is why fees belong on every row rather than being estimated once a year.
Strike selection
Strike does not appear in the cash arithmetic either, but it sets the premium you can collect and the chance of assignment. A 50 put sells for less than a 52 put on the same expiration; the higher strike pays more and is closer to being in the money.
Where you see it in MetisTrades
MetisTrades builds positions from your imported transactions, then shows the same credit, debit and realized figures you just worked out by hand.
Closed Positions is the historical table for positions that no longer have open exposure. It uses your imported transactions to summarize realized outcomes, holding time, premiums, strategies and roll-chain results. Its expandable performance summary shows Closed Trades, Win Rate, Total P/L and Avg Days in Trade, with Best Trade and Worst Trade when available. In the table itself, the columns that match your log are Total Credit, Total Debit and Realized P/L — both premium columns appear before Realized P/L in the column list, with Projected Price between them and it. Compare a row's Realized P/L with your own position cash to date for the same position.
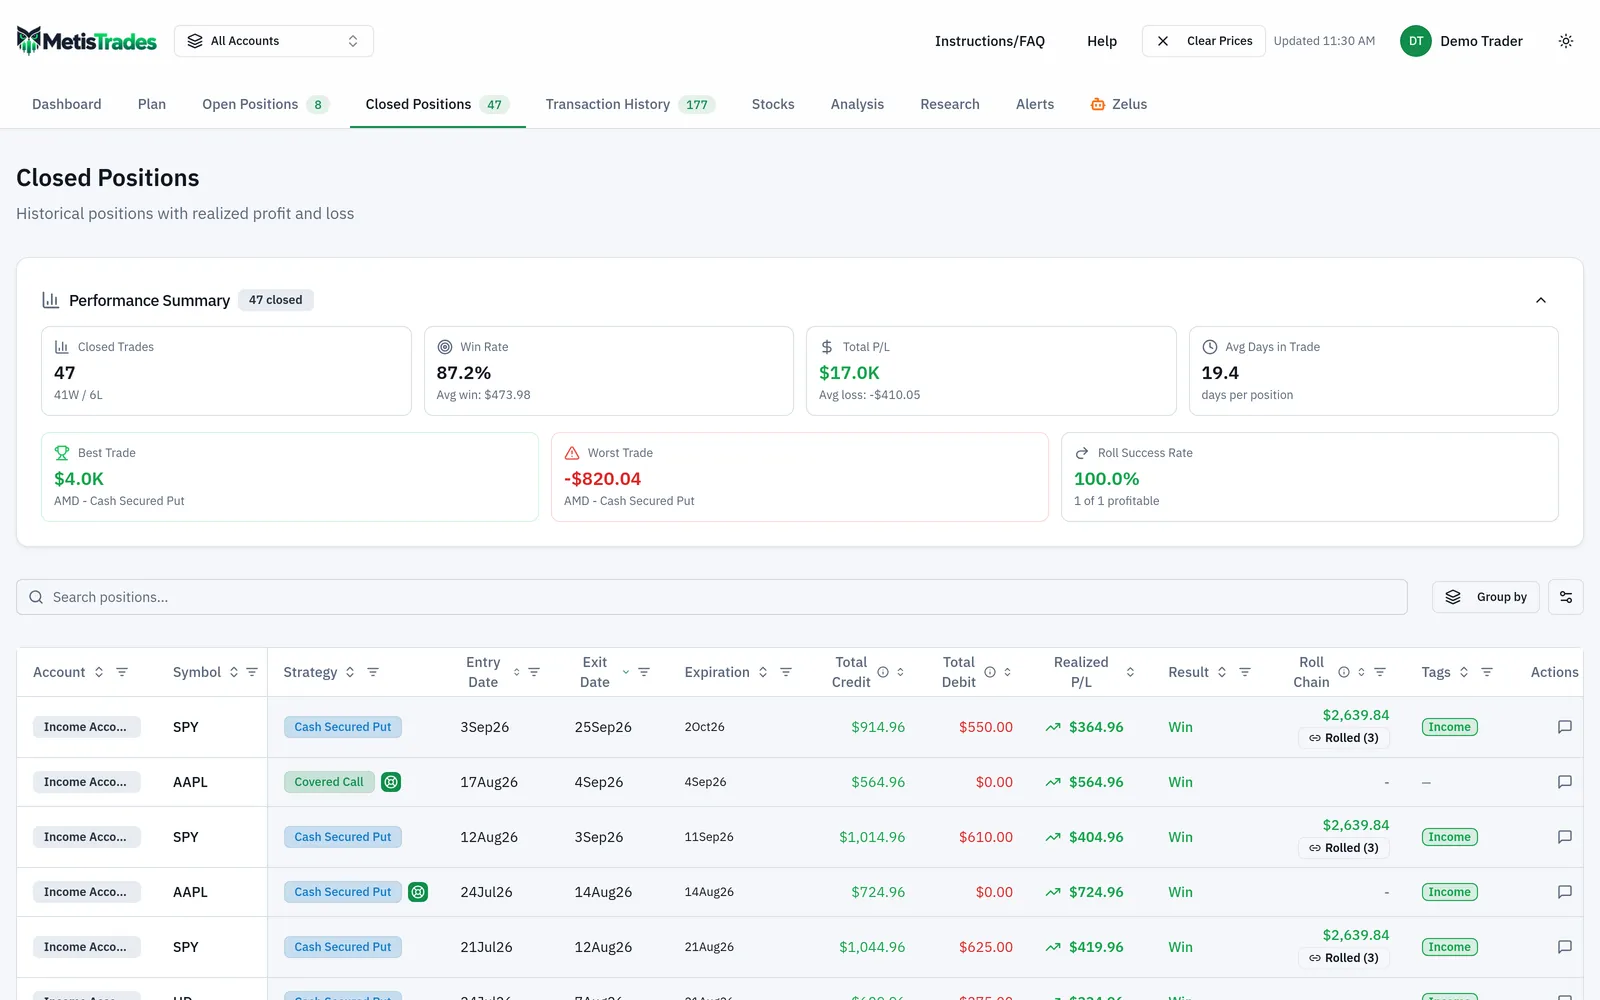
Two more columns on that table restate ideas from the worked example. Credit/Debit reports whether total premium received minus total premium paid is positive, negative or Even — the same test that separated your short put from your long call. Result reads Win when realized P/L is zero or positive and Loss otherwise, and % Return divides realized P/L by the position's transaction-derived cost basis. Closed rows do not need delayed quotes for realized figures, although any stock or chain value that still uses an open holding can depend on the latest available price.
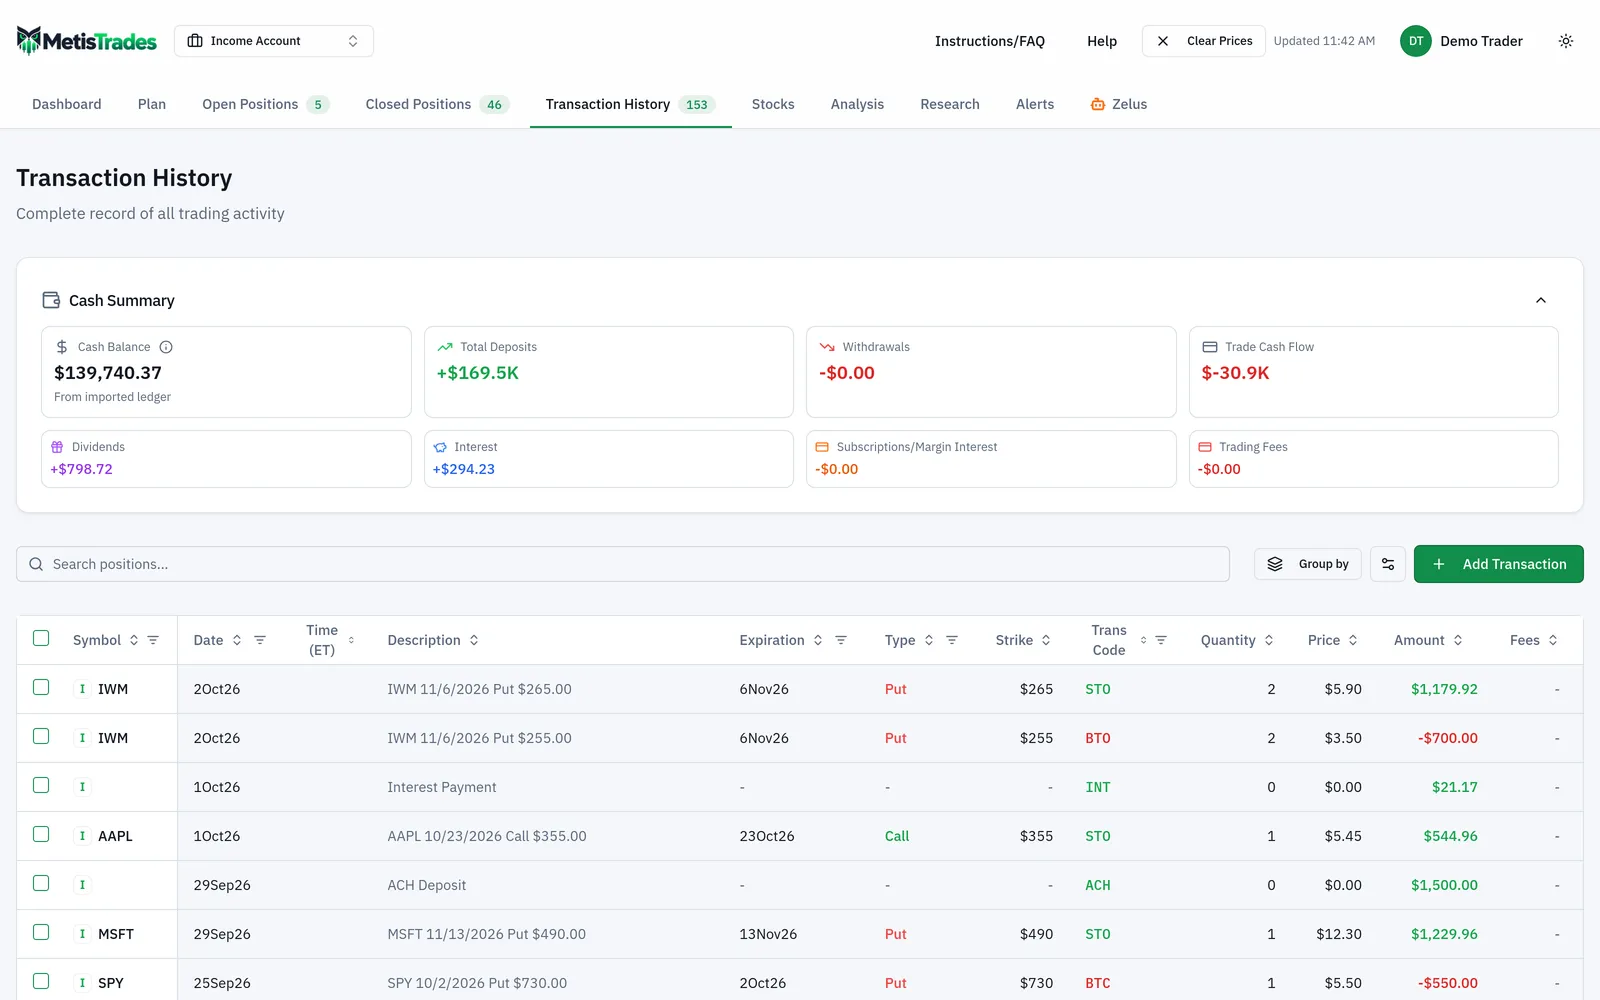
If a trade you expected is not on Closed Positions, the usual causes are unmatched or remaining open quantity, or an active filter. The page directs you to Transaction History to check, and to Clear All Filters to restore the full list. A partial close leaves remaining exposure, so one closing transaction does not necessarily move the whole strategy across.
For positions that are still open, the distinction from the first section applies directly. Standard P/L shows only the credits and debits recorded so far — the equivalent of stopping your log after row one, at 298.70. Live P/L adds an estimate of what the open legs are worth using the latest available fetched prices. The site header offers Refresh Prices when you have open positions or stock holdings and no prices are cached, and shows Clear Prices and Updated with a time after a fetch. The interface warns that quotes can be delayed by up to roughly 15 minutes, and some provider and instrument combinations use end-of-day values, so Live P/L is never an executable liquidation quote.
Anonymous visitors can use Closed Positions after uploading transactions into their browser session. Pro users can use the signed-in portfolio version.
Common mistakes
- Reading premium as the cost of the contract. A 1.50 quote is per share. Multiply by contracts and by the contract multiplier before writing any cash amount down.
- Assuming every contract is 100 shares. Mini options use 10 and futures options use a broker-supplied multiplier. Confirm the multiplier on the contract before calculating.
- Treating the opening credit as profit. The 298.70 in row one is cash held against an obligation. Only after the closing fill, expiration or assignment is the 217.40 result known.
- Logging fees once, or not at all. Fees are charged on the way in and the way out — 3.90 across six contracts here. Put a fee figure on every row.
- Getting the sign wrong when closing a long. Sell to close is a credit on an existing long, not a new short. Record the side per fill and let the running total per position do the work.
- Reading Standard P/L on an open position as an exit value. It reflects recorded cash flows only; use Live P/L if you want open legs marked, and remember those quotes are delayed.
- Expecting the app's totals to match the broker's tax forms. Realized P/L, cost basis and tax figures in MetisTrades are estimates from your imported transactions, not a substitute for your broker's 1099-B.
Related guides and help pages
Related guides
- Calls and Puts: What an Option Contract Actually Is
- Contract size and the 100-share multiplier
- The Greeks in practice: delta, theta, vega and gamma
- Implied Volatility: What Option Prices Say About Movement
- Assignment and Exercise Explained: Shares, Cash and Basis
- What Happens at Expiration: Worthless, Assigned, Exercised or Closed