Implied Volatility: What Option Prices Say About Movement
Implied volatility is the market's price for movement, not direction. Work through a 30-day example on XYZ by hand — expected move, realized volatility, IV rank and percentile — then see where those numbers appear in MetisTrades.
What it is and why it matters
Implied volatility (IV) is the level of future movement implied by an option's market price under an option-pricing model. You do not observe it directly. You observe a price — a bid, an ask, a midpoint — and then solve backwards: what annualised rate of movement would a pricing model need to assume to produce that price?
Three terms it depends on:
- Strike — the fixed price at which a call holder may buy or a put holder may sell.
- At the money (ATM) — an option whose strike sits at or very near the underlying price. ATM options carry the most extrinsic value, so their prices are the cleanest read on implied movement.
- Extrinsic value — the part of an option's price above its intrinsic value, reflecting remaining time, implied volatility, rates, and supply and demand. Implied volatility lives entirely inside extrinsic value.
The single most important thing to understand: IV is a width, not a direction. A 40% IV does not say the stock is going up or down. It says the market is pricing a wider range of possible outcomes than a 20% IV does. Both a crash and a melt-up are priced in by the same number.
Why a trader should care. If you sell premium, IV is most of what you are paid for. If you buy options, IV is most of what you pay. And because IV is quoted as an annualised percentage, it is portable: you can compare a $40 stock with a $400 stock on the same scale, which you cannot do with dollar premiums.
There are two more ideas layered on top. Realized volatility is how much the stock actually moved, measured from past closes. IV rank and IV percentile place today's IV inside that symbol's own history, because 32% IV is high for one ticker and low for another. The rest of this guide works all of these out with pencil and paper on a sample ticker, XYZ, and then shows where MetisTrades displays the same figures.
Work it out by hand
XYZ closed at $100.00. The expiration roughly 30 calendar days out has an ATM call quoted at a $3.70 midpoint and an ATM put at $3.65. The solved ATM implied volatility is 32.0%. Over the last 52 weeks, ATM IV on XYZ has ranged from a low of 18.0% to a high of 54.0%, across 252 daily observations.
Step 1: turn an annual percentage into an expected move
IV is annualised. To get the move for a shorter period, multiply by the square root of the time fraction, not by the time fraction itself. Volatility scales with the square root of time because variance — not standard deviation — adds up linearly.
Thirty calendar days is 30 ÷ 365 = 0.0822 years. The square root of 0.0822 is 0.2867. So the one–standard-deviation move is 0.32 × 0.2867 = 0.0917, or 9.17%. On a $100 stock that is $9.17, giving a one-standard-deviation band of roughly $90.83 to $109.17 by expiration.
Under the lognormal model that produced the IV, about 68% of outcomes land inside one standard deviation. That is a modelled share, not a promise — real return distributions have fatter tails than the model assumes.
Step 2: sanity-check it against the daily move
Traders usually think in trading days, of which there are about 252 a year. The square root of 252 is 15.87. So 0.32 ÷ 15.87 = 0.0202, about 2.02% a day, or $2.02 on XYZ. If XYZ has been drifting half a percent a day, a 32% IV is pricing something much livelier than recent behaviour.
Step 3: read the straddle
A straddle is a call and a put at the same strike and expiration. The ATM straddle here costs $3.70 + $3.65 = $7.35, which is $735 per one-contract pair at 100 shares per contract. Breakevens at expiration are $100 − $7.35 = $92.65 and $100 + $7.35 = $107.35.
The rule of thumb is that an ATM straddle prices at roughly 0.8 of the one-standard-deviation move: 0.8 × $9.17 = $7.34, against the market's $7.35. The two agree, which tells you the quoted prices and the solved IV are consistent with each other. The straddle breakeven is a narrower band than one standard deviation — around 7.35% rather than 9.17% — so do not treat "the implied move" and "one standard deviation" as the same number.
Step 4: measure what actually happened
Realized volatility uses closes, not option prices. Take the last 20 trading sessions, compute each day's log return, square each one, and add them up. Suppose that sum is 0.0048.
Daily variance is 0.0048 ÷ 20 = 0.00024. The daily standard deviation is the square root of that, 0.01549, or 1.549% a day. Annualise by multiplying by the square root of 252: 0.01549 × 15.87 = 0.2459, so 20-day realized volatility is 24.6%.
Step 5: compare the two
The volatility risk premium (VRP) is ATM IV minus annualised 20-day realized volatility, expressed in volatility points: 32.0 − 24.6 = +7.4 points. Positive means options are implying more movement than the stock has recently delivered. It does not mean the options are mispriced — the market may be pricing an event the past 20 days know nothing about.
Step 6: place today's IV in its own history
IV rank uses only the extremes of the window: (32.0 − 18.0) ÷ (54.0 − 18.0) × 100 = 14 ÷ 36 × 100 = 38.9. Today's IV sits 38.9% of the way up the 52-week range.
IV percentile counts observations instead. If 189 of the 252 daily readings are strictly below 32.0%, the percentile is 189 ÷ 252 = 75.0. So XYZ is at the 75th percentile of its year while ranking only 38.9 on the high-low scale. Both are correct. The gap exists because one brief spike to 54% stretched the range while leaving most days clustered low. Reporting either measure needs enough history; MetisTrades requires at least 20 historical observations before showing IV rank or IV percentile.
| Input or result | Value | How it was obtained |
|---|---|---|
| XYZ underlying close | $100.00 | Given |
| Days to expiration | 30 calendar days (0.0822 years) | 30 ÷ 365 |
| ATM implied volatility | 32.0% | Solved from the option prices |
| Square root of time | 0.2867 | √0.0822 |
| 1 SD move, 30 days | 9.17% = $9.17 | 0.32 × 0.2867 × $100 |
| Implied daily move | 2.02% = $2.02 | 0.32 ÷ √252 |
| ATM call midpoint | $3.70 | Given |
| ATM put midpoint | $3.65 | Given |
| ATM straddle | $7.35 ($735 per contract pair) | $3.70 + $3.65 |
| Straddle breakevens | $92.65 and $107.35 | $100 ∓ $7.35 |
| Rule-of-thumb straddle | $7.34 | 0.8 × $9.17 |
| Sum of squared daily returns (20 sessions) | 0.0048 | Given |
| Daily standard deviation | 1.549% | √(0.0048 ÷ 20) |
| 20-day realized volatility | 24.6% | 0.01549 × √252 |
| VRP | +7.4 points | 32.0 − 24.6 |
| 52-week ATM IV low / high | 18.0% / 54.0% | Given |
| IV rank | 38.9 | (32 − 18) ÷ (54 − 18) × 100 |
| Observations below 32% (of 252) | 189 | Given |
| IV percentile | 75.0 | 189 ÷ 252 × 100 |
What changes the outcome
Each change below alters exactly one input from the worked example and leaves the rest alone.
Time to expiration
Stretch 30 days to 60. The time fraction becomes 60 ÷ 365 = 0.1644, whose square root is 0.4054. The expected move is 0.32 × 0.4054 = 12.97%, or $12.97 — not double $9.17, but 1.414 times it. Doubling the time multiplies the expected move by √2. This is why premium per day is higher in short-dated options even though the total dollars are smaller.
The IV level itself
Raise IV from 32% to 40% with 30 days unchanged: 0.40 × 0.2867 = 11.47%, or $11.47. The expected move scales linearly with IV at fixed time. In option dollars, vega — the change in value for a one-percentage-point IV change — is about $11 per contract for this 30-day ATM option, so an 8-point rise is worth roughly $90 per contract to a long holder and the same against a short one.
The underlying price
Keep IV at 32% but put the stock at $50. The percentage move is unchanged at 9.17%, but the dollar move halves to $4.59. IV is a percentage; dollars follow the price. That is why you compare IV across tickers and dollar premium only within one.
Realized volatility
Suppose the sum of squared daily returns over the 20 sessions was 0.0096 instead of 0.0048. Daily variance becomes 0.00048, the daily standard deviation 2.191%, and annualised realized volatility 34.8%. VRP flips to 32.0 − 34.8 = −2.8 points: options are now implying less movement than the stock has been delivering, with the same 32% IV.
The history window
If XYZ's 52-week high had been 40% rather than 54%, IV rank becomes (32 − 18) ÷ (40 − 18) × 100 = 63.6 — from 38.9 to 63.6 without IV changing at all. Rank is only as meaningful as the window behind it, and a single spike can hold the denominator open for a year.
Strike and skew
ATM IV is one point on a surface. The 25-delta put on the same expiration might solve to 36% while the 25-delta call solves to 29%. The 32% figure describes the money, not the wings, so a position built out of the money can be priced on quite a different volatility.
Events inside the expiration
If an earnings report falls inside those 30 days, part of the 32% is paying for one date rather than 30 evenly spread ones. The same IV with no event in the window is a different proposition. Comparisons across symbols are fairest when their event calendars are similar.
Size and fees
Two straddles instead of one doubles the dollars to $1,470 and doubles every exposure, including vega. Commissions do not scale the IV but do move your result: at $0.65 per contract, selling one straddle costs $1.30, so $735 collected becomes $733.70 net and the breakevens tighten by about a penny each to $92.66 and $107.34.
Where you see it in MetisTrades
MetisTrades computes these statistics from end-of-day snapshots. The snapshot sweep is scheduled for 5:00 p.m. Eastern on trading weekdays and skips weekends and exchange holidays, so every volatility figure you see describes a stored market date rather than the moment you opened the page. Check the date before reading anything into a number.
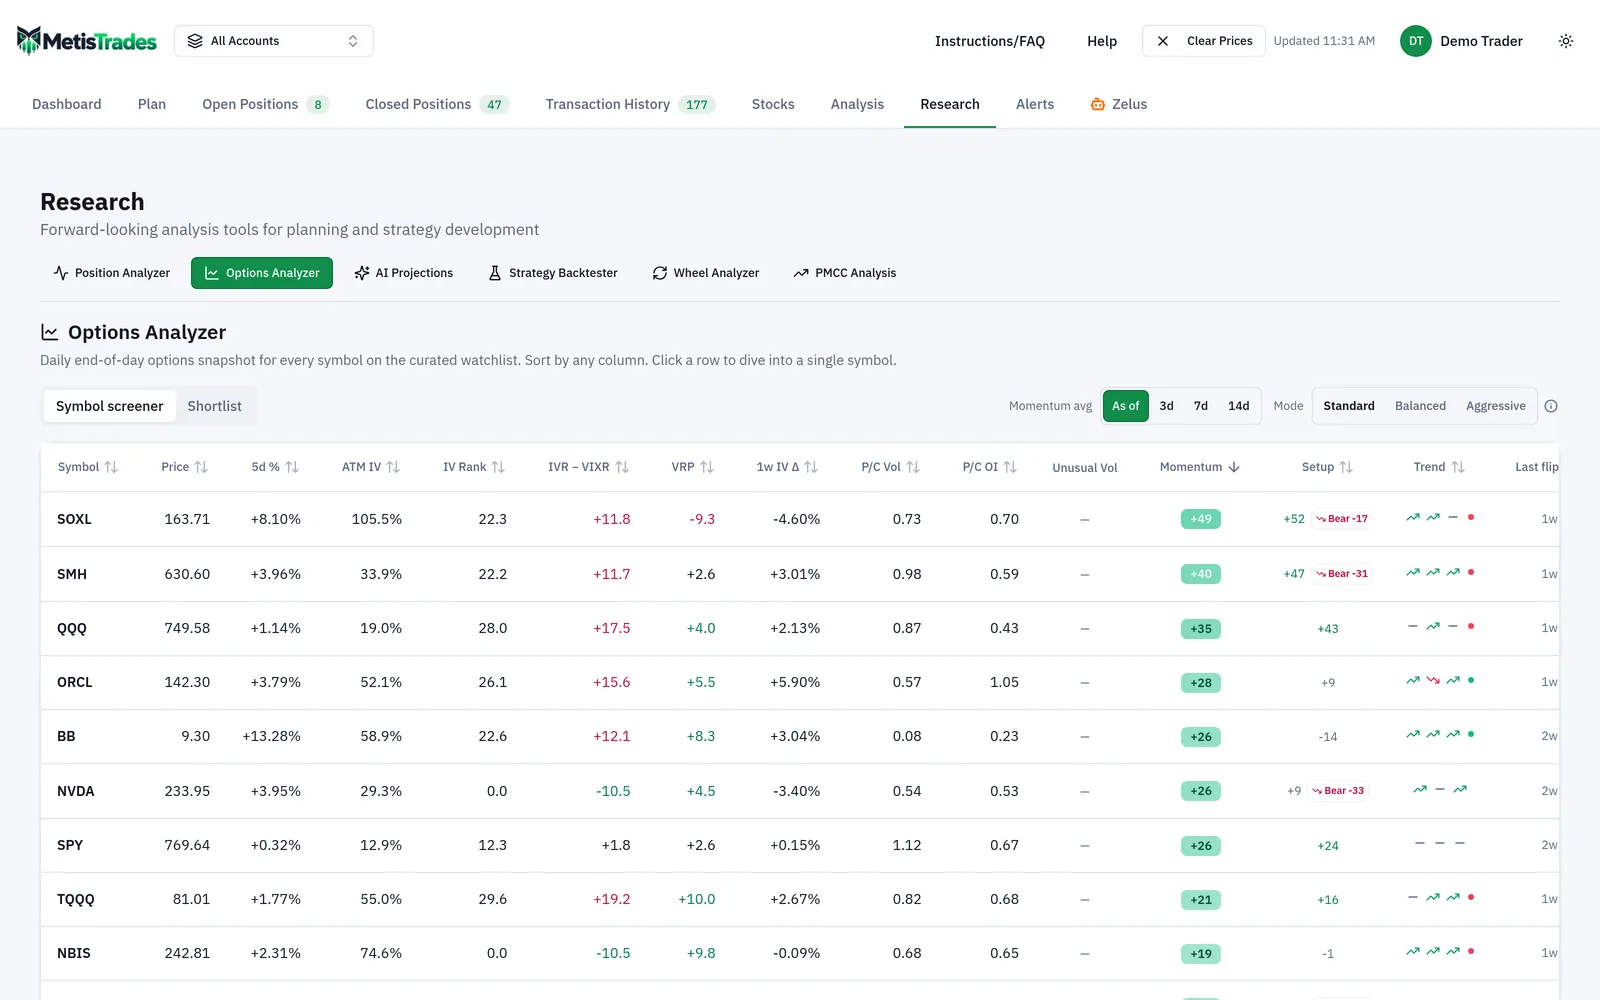
The first place these numbers appear together is Options Analyzer (Research → Options Analyzer), an end-of-day screening board for symbols on a curated watchlist. In the Symbol screener view, each row carries the exact columns from the worked example: ATM IV (at-the-money implied volatility for the roughly 30-day expiration — the 32.0% figure), IV Rank (today's ATM IV within its trailing 52-week range — the 38.9), VRP (ATM IV minus 20-day realized volatility — the +7.4 points), 1w IV Δ (the change in ATM IV over the trailing five trading days) and IVR − VIXR, which subtracts the VIX 52-week rank from the symbol's IV rank so you can see whether the symbol is rich or cheap against broad-market volatility rather than only against itself. Last Updated shows the date of the most recent snapshot. Every sortable column sorts in either direction, and missing values stay at the bottom rather than being filled with guesses.
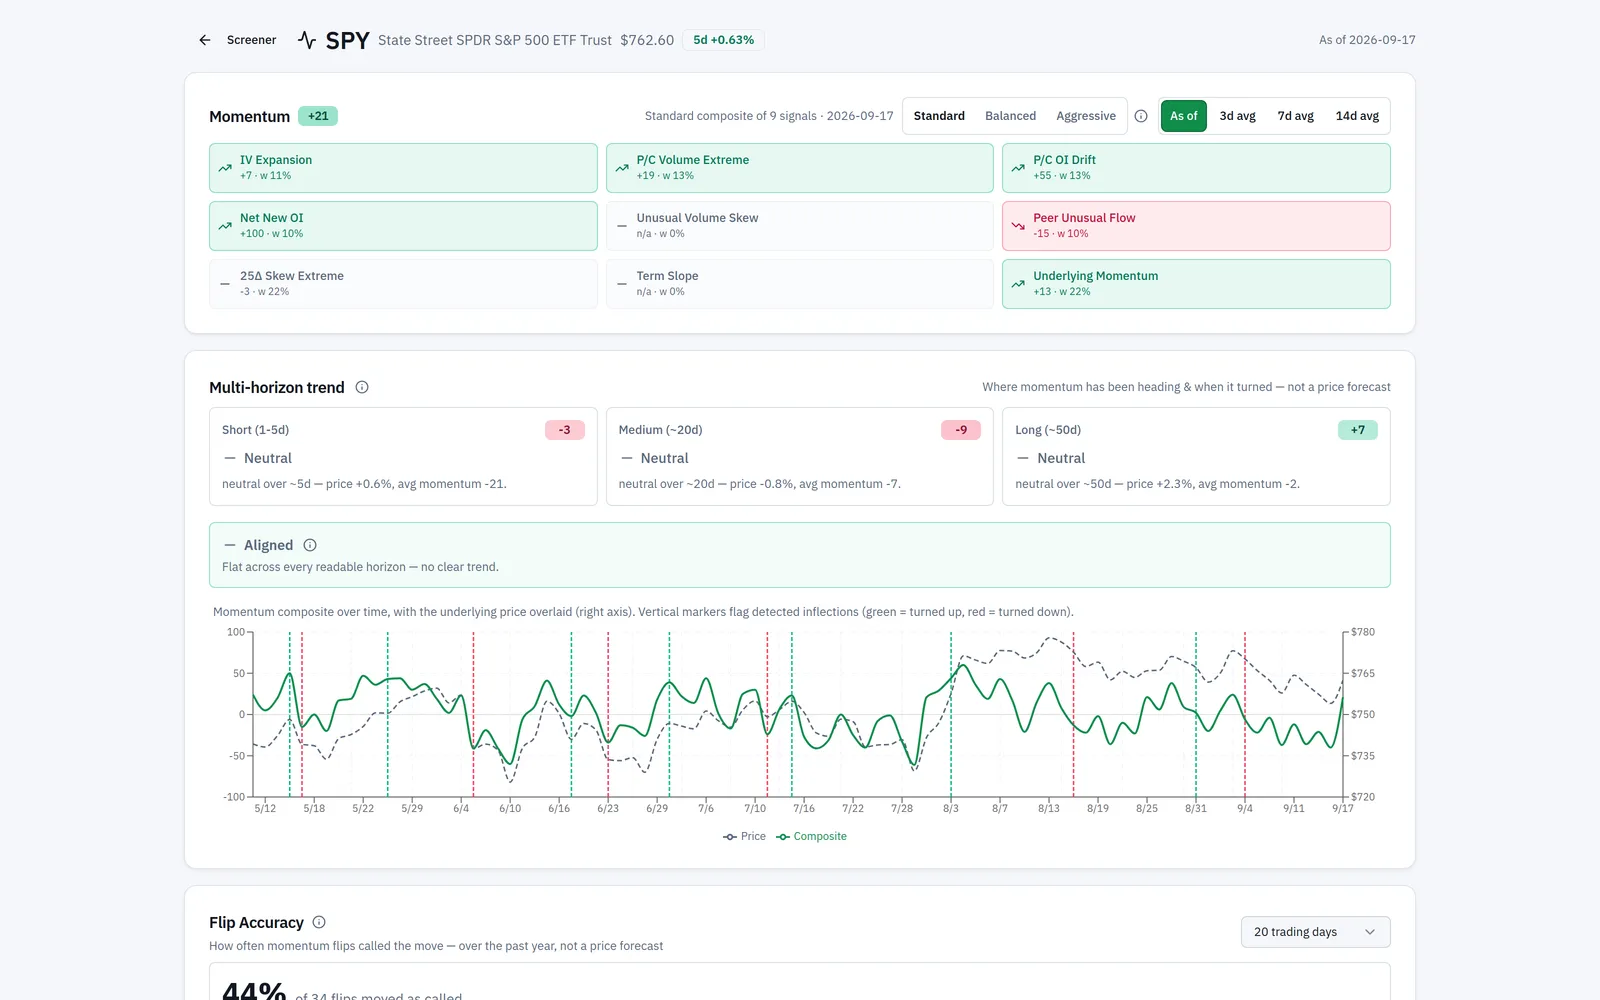
Some watchlist symbols are open to any viewer, including an anonymous session; paid-tier symbols appear as locked rows unless you have Pro. Selecting an unlocked row opens that symbol's deep dive, which is where the volatility picture gets its history. The header carries the As of snapshot date and, when known, an Earnings badge with the next report date and days until it — the event-timing check from the section above. Snapshot Metrics shows IV Rank 52w alongside P/C Volume, P/C OI and Term Slope, with As of, 3d, 7d and 14d averaging; a separate VRP tile appears when that reading exists and shows its percentile within the symbol's own recent history, which is the same "place it in context" move you made by hand.
Two history cards do the comparison work. ATM IV Trend plots roughly 30-day ATM IV with 30-day and 90-day moving averages; its VIX control adds or removes VIX on the right axis, and the panel can also show VIX rank, 60-day IV/VIX correlation, and an expanding or compressing IV badge. Volatility Risk Premium Trend plots ATM IV minus 20-day realized volatility in volatility points — the +7.4 drawn through time, so you can see whether today's gap is normal for this symbol. Known earnings dates are marked on these charts. The range buttons are 180d, 90d and 30d, with 90d selected initially; with fewer than 20 snapshot days the cards say more data is needed.
For the contract-level view, Current Chain is collapsed initially and offers sortable columns for expiration, strike, type, bid, ask, volume, open interest, IV and Greeks — this is where you would read the 36% put and 29% call that make up the skew. You can select two contracts with the same expiration and use Compare strikes, and contract history can plot price, IV, Greeks, OI, volume, underlying close and VIX. Today's Unusual Activity also shows an IV column per contract.
Across all of these, the displayed prices are stored closes or end-of-day option midpoints, not executable quotes. They are a reference for study and screening; verify the current market before acting on anything.
Common mistakes
- Reading high IV as a bullish or bearish signal. IV prices the width of the range, not its direction — check skew and positioning separately if you want a directional read.
- Comparing raw IV across tickers. A 32% IV is cheap for one symbol and rich for another; use IV rank or IV percentile, which measure against the symbol's own history.
- Treating IV rank and IV percentile as the same number. Rank uses only the 52-week low and high, percentile counts how many observations sat below today — our example gave 38.9 and 75.0 from identical data.
- Scaling IV linearly with time. Doubling 30 days to 60 multiplies the expected move by √2 (9.17% to 12.97%), not by 2.
- Taking a positive VRP as an edge. The +7.4 points compares an implied forward number with a backward-looking 20-day measure; an event inside the expiration can justify the whole gap.
- Confusing the straddle price with one standard deviation. The $7.35 straddle is about 0.8 of the $9.17 one-standard-deviation move, so quoting it as "the one-sigma range" understates the band.
- Assuming the screener shows the current market. Every IV, rank and VRP figure comes from an end-of-day snapshot — read the Last Updated or As of date before drawing a conclusion.
Related guides and help pages
Related guides
- Plan, Track, Optimize: a complete tour of MetisTrades
- Calls and Puts: What an Option Contract Actually Is
- Premium, Credits and Debits: How Option P/L Is Counted
- Contract size and the 100-share multiplier
- The Greeks in practice: delta, theta, vega and gamma
- Assignment and Exercise Explained: Shares, Cash and Basis