Win Rate Is Not Enough: Expectancy and Profit Factor
A 87.5% win rate can still leave you with almost nothing to show for it. Learn how average win, average loss, expectancy and profit factor complete the picture, how to calculate them by hand, and where MetisTrades already does the counting.
What it is and why it matters
Win rate is the share of your closed trades that made money. It is the easiest performance number to calculate and the easiest one to misread. Seven wins out of eight closed trades reads as 87.5%, which sounds like a system working well. It tells you nothing about how big the wins were, or how big the one loss was.
Three other numbers finish the sentence that win rate starts.
Average win and average loss are the mean profit across your winning trades and the mean loss across your losing trades. They set the exchange rate between your wins and your losses. If your average loss is six times your average win, you need a very high win rate just to stay level.
Expectancy is what one trade is worth on average, in dollars, given your own history:
Expectancy = (win rate × average win) + (loss rate × average loss)
Because the average loss is a negative number, the second term subtracts. Expectancy answers the only question that matters over a long run of trades: when I put this trade on again, what is the typical dollar outcome, counting the bad ones?
Profit factor approaches the same idea from the cash side:
Profit factor = gross wins ÷ gross losses
Gross wins is every winning trade's profit added up. Gross losses is the absolute total of every losing trade. A profit factor of 2.0 means you collected two dollars of gross profit for every dollar of gross loss. A profit factor of 1.0 is break-even. Below 1.0 you are losing money regardless of how many individual trades closed green.
Selling options tends to produce high win rates by design: most short premium trades expire worthless, and the ones that do not can lose a multiple of the credit collected. That shape makes win rate the least informative number in the set and expectancy the most informative. Neither figure predicts the next trade. Both describe what has already happened in your own records, which is the only honest place to start.
How to track it by hand
You need one row per closed trade and four pieces of information: the close date, the symbol, the realized profit or loss in dollars, and whether it was a win. Everything else is arithmetic on those columns.
Choosing what counts as one trade
Decide this before you start, and stay consistent. The convention used here is: a whole roll chain is one trade. If you sold a put, rolled it twice and finally closed it, that is one row with the combined result, not three rows. Counting each roll segment separately inflates your trade count and usually inflates your win rate, because the intermediate segments close for small credits while the final segment carries the real outcome.
The worked example
Eight trades closed between January and February. Seven small winners and one bad February. The Win (1/0) and Running P/L columns are computed; you type only the first three.
| Closed | Symbol | P/L | Win (1/0) | Running P/L |
|---|---|---|---|---|
| 2026-01-09 | XYZ | 100 | 1 | 100 |
| 2026-01-16 | ABC | 90 | 1 | 190 |
| 2026-01-23 | XYZ | 110 | 1 | 300 |
| 2026-01-30 | DEF | 80 | 1 | 380 |
| 2026-02-06 | ABC | -600 | 0 | -220 |
| 2026-02-13 | XYZ | 120 | 1 | -100 |
| 2026-02-20 | DEF | 95 | 1 | -5 |
| 2026-02-27 | XYZ | 105 | 1 | 100 |
The spreadsheet below already contains these eight rows and every formula described here, so you can replace the figures with your own and watch the totals move.
Download the template: Expectancy calculator (.xlsx). It opens in Excel, and in Google Sheets via File → Import. The worked example from this guide is already filled in, and the formulas carry down into the blank rows.
The two computed columns are straightforward. Win (1/0) flags a profitable row: =IF(A{r}="","",IF(N(C{r})>0,1,0)). Running P/L is a cumulative sum from the first row down to the current one: =IF(A{r}="","",SUM($C${first}:C{r})). The running column is worth having because it shows the shape of the account, not just the endpoint. After four trades you were up 380. One trade later you were down 220. It took three more winners to climb back to 100.
The arithmetic
Work through the totals one at a time.
Trades = 8. Count the rows.
Win rate = 0.875. Seven rows carry a 1 in the Win column. 7 ÷ 8 = 0.875, or 87.5%. The loss rate is whatever is left over: 1 − 0.875 = 0.125.
Average win = 100. Add the seven winners: 100 + 90 + 110 + 80 + 120 + 95 + 105 = 700. Divide by 7 and you get 100 exactly. That 700 is also your gross wins.
Average loss = -600. There is only one losing row, so the average loss is that row: −600. Gross losses is 600.
Expectancy per trade = 12.5. Apply the formula: (0.875 × 100) + (0.125 × −600) = 87.50 − 75.00 = 12.50. Each trade in this set was worth twelve dollars and fifty cents on average.
Profit factor = 1.166667. 700 ÷ 600 = 1.166667. For every dollar lost, 1.17 dollars were made.
Total P/L = 100. 700 − 600 = 100. Note the cross-check: expectancy × trades = 12.50 × 8 = 100, which matches total P/L exactly. That identity is always true, and it gives you a one-second way to get expectancy from any summary that reports total profit and a trade count.
What the numbers are telling you
An 87.5% win rate on its own suggests a strong edge. Expectancy says the whole two months produced 100 dollars across eight trades. Profit factor of 1.17 says the margin between gross wins and gross losses is thin.
Run the sensitivity yourself. Keep the win rate and average win identical, and ask how large a single loss would have wiped out the gains: 87.50 ÷ 0.125 = 700. An average loss of 700 instead of 600 drives expectancy to exactly zero and profit factor to exactly 1.00. The entire two-month result turned on the size of one trade, not on the other seven. That is the point of the exercise.
Where manual tracking breaks down
The arithmetic is simple. Getting eight honest rows into the sheet is where it goes wrong.
Missed rows. Losing trades are the ones you least want to type up, and the sheet only works if every closed trade appears. A single omitted −600 turns an expectancy of 12.50 into 87.50 — and the inflated figure is the one you would act on.
Partial fills and partial closes. You sell five contracts, buy back two this week and three next week. Is that one trade or two? If you log the two-lot close as a complete trade, your trade count rises, your average win falls and your win rate changes, all without a single real outcome changing.
Rolls. A roll is a close and an open on the same ticket. Logged literally, a put rolled three times becomes four rows: three small credits and one final result. Win rate goes up, average win goes down, and the trade count no longer means what you think it means.
Assignments and exercises. A short put that gets assigned does not close with a buy-to-close trade. The option's result and the share position that replaced it live in two different places, and the dollars only reconcile when you follow the shares through to their eventual sale.
Multiple accounts. Two brokers, two export formats, two sets of dates. Expectancy computed on one account and applied to the other is a comparison of different things.
Corrections. Broker records get adjusted, fees post late, a trade you entered from memory turns out to have filled at a different price. Once you have retyped a correction into the sheet, the running total and every derived ratio shift, and the old screenshot you saved no longer matches.
None of these is hard to fix individually. Together they mean the sheet drifts away from the broker record over months, which is exactly the horizon over which expectancy becomes meaningful.
How MetisTrades does it
MetisTrades builds positions from imported transactions, so the row-per-trade problem is handled before you look at any number. Everything below is an estimate derived from those transactions.
Start with Closed Positions
Open Closed Positions from the top nav. It lists positions that no longer have open exposure, sorted by Exit Date descending so the most recent closes appear first. The expandable performance summary above the table is your expectancy input set: Closed Trades, Win Rate, Total P/L, Avg Days in Trade, and where available Best Trade and Worst Trade. Look at Closed Trades and Total P/L together — that pair is all you need for expectancy per trade.
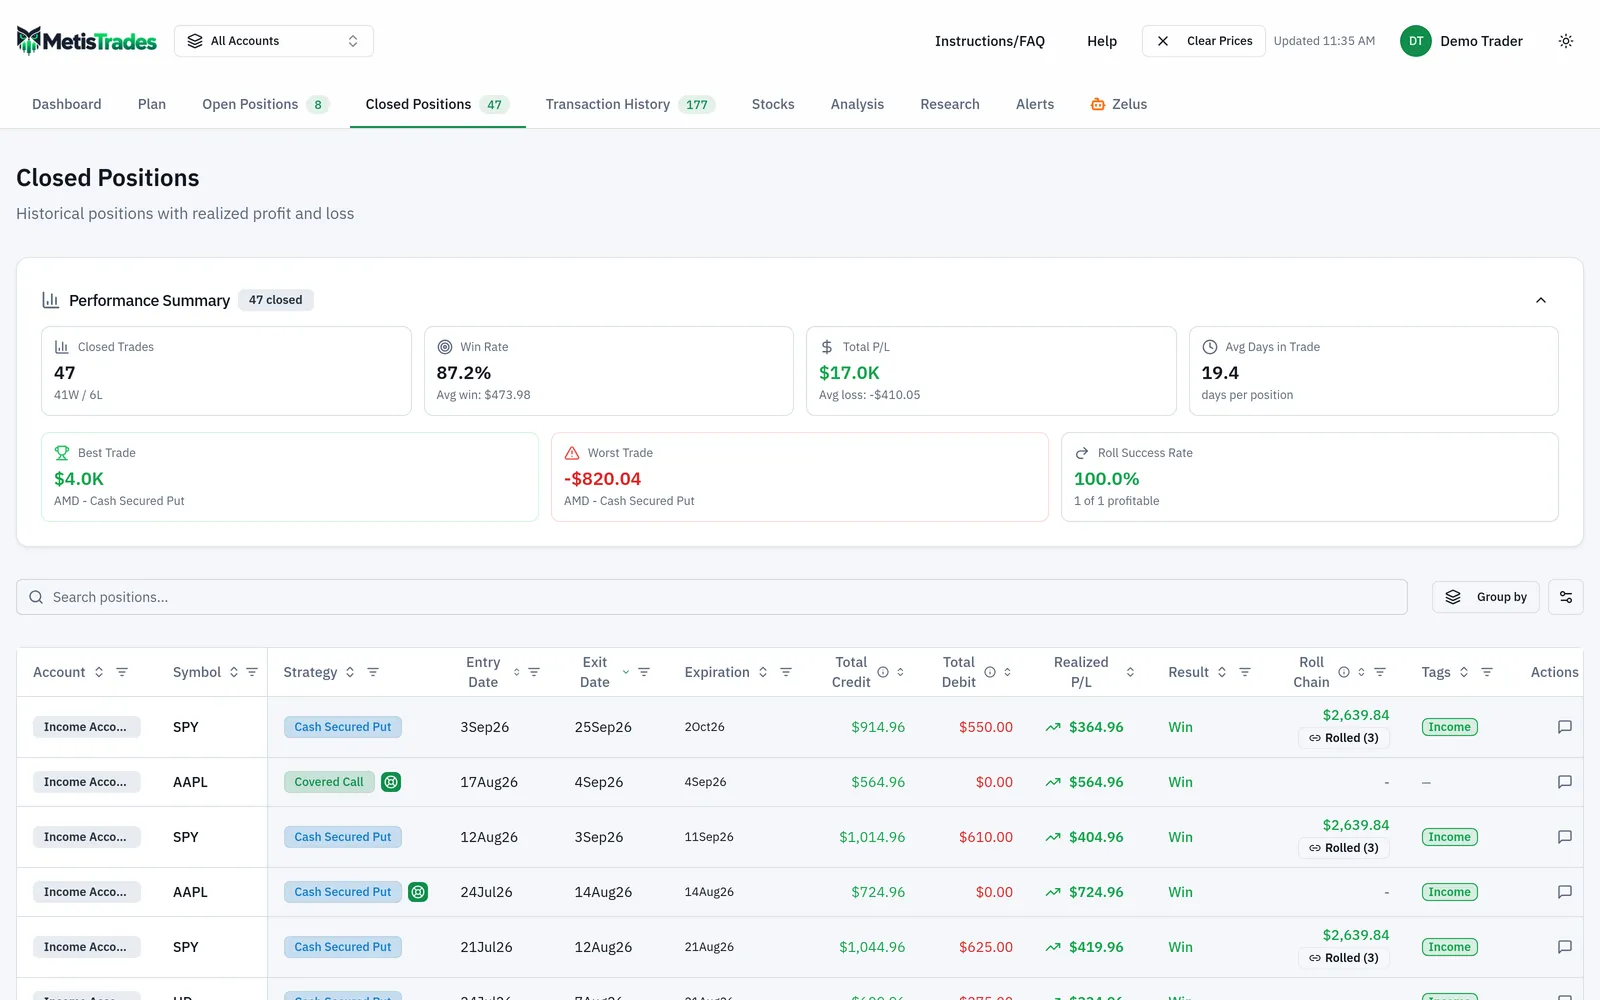
Win Rate here is winning closed positions divided by all closed positions. Best Trade and Worst Trade identify the highest and lowest position P/L, which is the fastest way to see whether one outcome is carrying the whole result, as the −600 does in the worked example.
Split wins from losses to get profit factor
Profit factor needs gross wins and gross losses separately. The table's filterable column headers include Result, and the totals row — labelled Totals · N positions — recalculates after search and column filters. Filter Result to Win to see how many winning positions are in scope and read their Realized P/L figures; then filter to Loss for the other side. Dividing one gross total by the other gives you profit factor. Clear All Filters puts the full list back.
Keep roll chains as one trade
The Roll Chain column shows the final realized P/L across the entire chain, and a Rolled (N) badge reports the chain's roll count. Select the row to open Complete Roll Chain, then expand Roll Chain History for lifetime credits, debits, closed-segment P/L and the final chain outcome. Realized P/L on a row is the result for that segment; Roll Chain is the result for the whole lifecycle. Use the chain figure when you want your records to match the one-row-per-chain convention from the spreadsheet.
Group and slice before you judge
Open Group by to organize closed rows by Strategy, Symbol, Result (Win / Loss), Credit / Debit, entry or exit date, or Tag where Tags is visible. Expectancy for a whole account mixes strategies that behave differently; grouping lets you look at one at a time. Days in Trade (DIT) is hidden until you turn it on from Customize columns, and it is worth adding — a strategy with the same expectancy but half the holding period is doing more work with your capital.
Check the period view on the Dashboard
The Dashboard carries the same headline figures for a chosen window. Use the Time Period: control to pick This Year, Last 90 days, a year from the By Year list, or an exact interval with Select date range. The Win Rate tile also shows wins and losses as W / L, which hands you the two counts directly, and Total P/L (realized) gives the numerator for expectancy over that window.
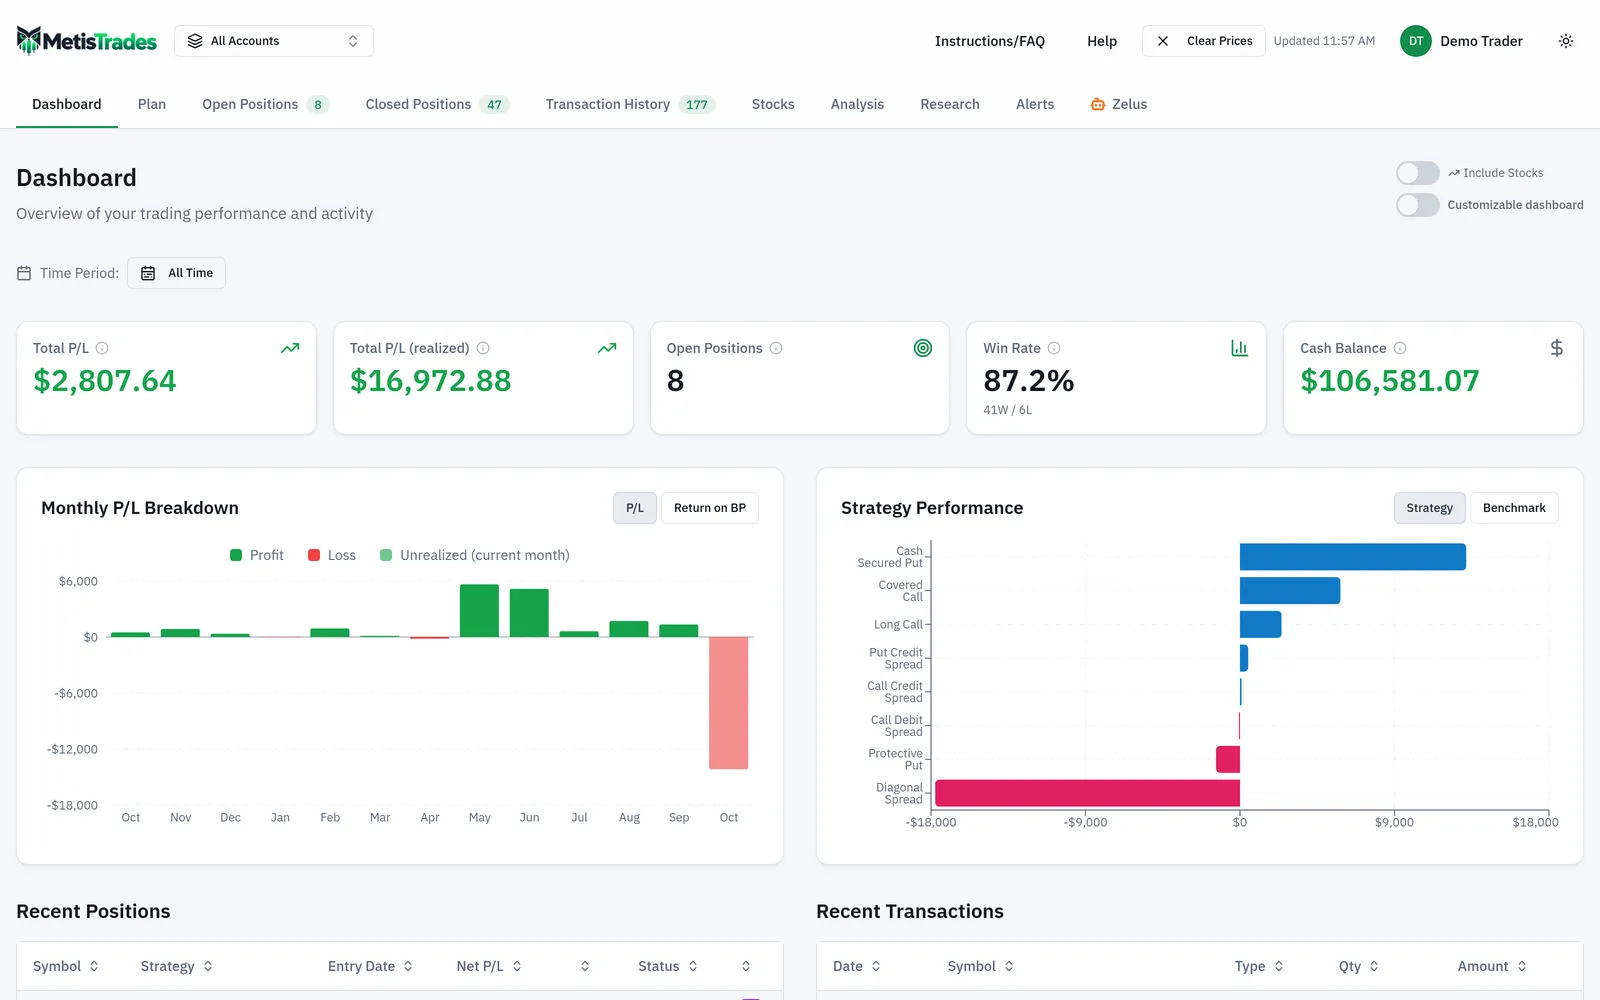
The Strategy Performance chart groups total and average P/L by the strategy shown on each position, including any strategy override you have set. Average P/L by strategy is expectancy by strategy under a different name: it is total profit divided by the number of positions in that group.
If you are not signed in, you can use the Dashboard and Closed Positions after uploading transactions into your browser session; nothing is saved. The signed-in portfolio version, tags, saved column preferences and notes belong to a Pro account. The Return on BP chart view and the Strategy / Benchmark switch are Pro as well.
How to read the results
Win Rate is a count, not a measure of money. In MetisTrades, Result is Win when realized P/L is zero or positive, so a scratch trade that closed for exactly zero lifts the win rate and adds nothing to the total. Read the number as "how often", never as "how well".
Total P/L ÷ Closed Trades is your expectancy per trade for whatever scope is on screen. In the worked example that is 100 ÷ 8 = 12.50. It is a backward-looking average of recorded outcomes. It does not forecast the next trade, and it is only as representative as the set it was drawn from — an 87.5% win rate computed over eight trades is a different kind of statement from the same figure computed over two hundred.
Average loss deserves more attention than average win, because it is the term you can usually control through position sizing and exits. Worst Trade in the summary shows the largest single loss in scope; if Worst Trade is close in size to Total P/L, your result is one trade away from flipping.
Profit factor near 1.0 means gross wins and gross losses are nearly matched. At 1.166667, gross wins of 700 covered gross losses of 600 with 100 to spare. It is a ratio, so it ignores scale: a profit factor of 1.17 on eight trades and on eight hundred describe very different levels of confidence.
% Return and Return on BP express the same outcomes as percentages. % Return is realized P/L divided by the position's transaction-derived cost basis. Return on BP is realized P/L divided by the BP at Open value you entered manually for that position, so it exists only where you supplied it. Dollar expectancy across trades of very different sizes can be misleading; the percentage views give you a second reading.
All of these figures are estimates derived from imported transactions, and realized figures do not depend on delayed quotes. Any value that still involves an open holding can depend on the latest available price, and quotes in MetisTrades are delayed.
Common mistakes
- Judging a strategy by win rate alone. 87.5% looked excellent and produced 12.50 a trade. Fix: divide Total P/L by Closed Trades every time you quote a win rate.
- Counting each roll segment as a separate trade. It inflates the trade count and the win rate while shrinking the average win. Fix: use the Roll Chain column's final realized P/L and count the chain once.
- Forgetting that a zero-P/L position counts as a Win. Scratch trades raise the win rate without adding a cent. Fix: check Best Trade, Worst Trade and Total P/L alongside the win rate.
- Comparing figures computed on different scopes. The summary depends on the transactions available for the selected trading account or all-account view, and Dashboard figures depend on the chosen Time Period. Fix: set the account scope and period deliberately before comparing anything.
- Reading one bad trade as a broken system, or ignoring it entirely. In the worked example a loss of 700 instead of 600 would have taken expectancy to zero. Fix: note how many closed trades the figure covers, and look at Worst Trade next to Total P/L.
- Mixing strategies in one expectancy number. Cash-secured puts and long calls do not share a distribution. Fix: use Group by Strategy on Closed Positions, or the Strategy Performance chart's average P/L.
- Treating imported figures as exact. Imported files may omit unsupported or ambiguous rows, and everything derived from transactions is an estimate. Fix: review Your last import whenever it appears, and reconcile against your broker's own records.
Related guides and help pages
Related guides
- Analyzing closed-trade performance: win rate, expectancy and profit factor
- Plan, Track, Optimize: a complete tour of MetisTrades
- A 90% win rate and $100 to show for it: how rolls hide inside your stats
- Reading your dashboard statistics: what each headline number actually measures
- Trade Path: how far each closed trade ran for and against you
- MFE and MAE explained: are you closing winners too early?