Simulating the range of results ahead from your own closed trades
Your trading record is one sample of what could have happened. This guide shows how to resample your own closed trades by hand into a fan of outcomes, drawdowns and losing streaks — and where that method stops being trustworthy.
What it is and why it matters
Your closed-trade record shows one path. You took those trades in that order, and they added up to one number. But the order was partly luck, and so was the mix: the big loser could just as easily have landed three trades earlier, or twice, or not at all.
Resampling — also called a bootstrap — is a way of asking what else that same record could have produced. You take the list of your closed trades, draw from it at random with replacement (so any trade can come up more than once, or not at all), line the draws up into a sequence, and add them trade by trade. That is one simulated future. Do it a few thousand times and you get a distribution instead of a single number.
A few terms, used consistently below:
- Closed trade — one finished position and its total profit or loss (P/L), with all its legs, rolls and partial closes counted as a single result.
- Cumulative P/L — the running total as the simulated trades go by.
- Max drawdown — within one simulated run, the largest fall in cumulative P/L from a previous high. The high starts at $0, so a run that only loses has a drawdown equal to its loss.
- Losing streak — consecutive losing trades. A scratch (exactly $0) neither extends nor breaks one.
- Percentile — the 10th percentile is the value 1 in 10 runs fall below; the 90th is the value 1 in 10 exceed.
Why bother? Because the two questions that actually govern whether you can keep trading a method are "how deep can this go against me?" and "how long can the bad run last?" — and a single historical equity curve answers neither. It shows you the drawdown you happened to get, not the one that was available.
Be clear about what this is not. A trade-history bootstrap is not a market model. It does not price your open positions, model stock paths, or know anything about volatility, earnings or the next six months. It only reshuffles results you already recorded. Its honesty depends entirely on two assumptions: that your future trades will resemble your past ones, and that each trade is independent of the one before it.
How to track it by hand
Work through a deliberately small example so the arithmetic stays visible. Ten closed trades on XYZ, each one a completed position with a P/L and an exit date.
Step 1: list the closed trades
| # | Exit date | P/L | Cumulative | Running peak | Fall from peak |
|---|---|---|---|---|---|
| 1 | 14 Feb 2024 | +$120 | $120 | $120 | $0 |
| 2 | 22 Mar 2024 | +$85 | $205 | $205 | $0 |
| 3 | 19 Apr 2024 | −$240 | −$35 | $205 | $240 |
| 4 | 17 May 2024 | +$150 | $115 | $205 | $90 |
| 5 | 21 Jun 2024 | +$60 | $175 | $205 | $30 |
| 6 | 19 Jul 2024 | −$95 | $80 | $205 | $125 |
| 7 | 20 Sep 2024 | +$200 | $280 | $280 | $0 |
| 8 | 18 Oct 2024 | +$40 | $320 | $320 | $0 |
| 9 | 20 Dec 2024 | −$410 | −$90 | $320 | $410 |
| 10 | 13 Feb 2025 | +$130 | $40 | $320 | $280 |
Read the record first. Seven of ten trades were winners, so the win rate is 70%. The total is +$40, which over ten trades is an average of +$4.00 a trade. The deepest fall from a previous high was $320 − (−$90) = $410, which arrived on trade 9. The longest losing streak was 1 — no two losers ever landed back to back.
That combination is the whole reason to simulate. A 70% win rate alongside a $4 average trade tells you the result rests on where the two big losses fell, not on the win rate.
Step 2: measure your pace
Pace converts calendar time into trades. The first exit is 14 Feb 2024 and the last is 13 Feb 2025, a span of 365 days, over which 10 trades closed. That is a pace of 10 trades a year. So for this record, "a year's worth of trades" means 10 trades, and a quarter is roughly 2 to 3. Each simulated run below is therefore ten trades long — one year at this pace.
Step 3: draw the runs
Number the trades 1 to 10 and draw ten numbers at random, allowing repeats. Dice, a random-number generator, or digits from any table will do. Here are five runs. The draw column shows the trade numbers in the order they came up.
| Run | Draw order (trade #) | Year-end P/L | Max drawdown | Longest losing streak |
|---|---|---|---|---|
| 1 | 4, 1, 7, 9, 5, 2, 8, 3, 10, 6 | +$40 | $465 | 1 |
| 2 | 3, 9, 6, 1, 7, 5, 4, 2, 8, 3 | −$330 | $745 | 3 |
| 3 | 7, 5, 2, 8, 10, 1, 4, 6, 9, 7 | +$480 | $505 | 2 |
| 4 | 1, 3, 8, 9, 2, 10, 6, 5, 4, 1 | −$40 | $610 | 1 |
| 5 | 5, 8, 2, 4, 7, 10, 1, 6, 3, 9 | +$40 | $745 | 3 |
Take run 2 apart so the arithmetic is explicit. Its draws are −$240, −$410, −$95, +$120, +$200, +$60, +$150, +$85, +$40, −$240. The cumulative totals are −$240, −$650, −$745, −$625, −$425, −$365, −$215, −$130, −$90, −$330. The running high starts at $0 and never gets above it, so the max drawdown is 0 − (−$745) = $745. The first three draws are all losers, giving a streak of 3. Note that trade 3 was drawn twice and trade 10 never — that is resampling working as intended.
Run 5 makes the opposite point. It wins its first seven draws, climbing to $785, then takes −$95, −$240 and −$410 in a row and finishes at +$40 — the same year-end figure as run 1, after a $745 fall. Identical outcome, very different year to live through.
Step 4: summarise the runs
Sort the year-end figures: −$330, −$40, +$40, +$40, +$480. The median — the middle value — is +$40. Two of five runs finished below $0, so the chance of a losing year in this tiny sample is 40%. Sort the drawdowns: $465, $505, $610, $745, $745; the median is $610. Sort the streaks: 1, 1, 2, 3, 3; the median is 2, which is worse than anything the actual record produced.
If you hold $25,000 as starting capital, express the drawdowns as a share of it: $610 ÷ $25,000 = 2.4%, and the worst run's $745 ÷ $25,000 = 3.0%.
Step 5: test the outliers
Finally, ask how much of the picture rests on one or two trades. Remove the single best trade (+$200): the remaining nine sum to −$160, an average of −$17.78 a trade. Remove the single worst (−$410) instead: the remaining nine sum to +$450, an average of +$50.00. A record whose average trade swings from −$17.78 to +$50.00 on the removal of one trade each way is a record carried by outliers, and every simulated figure above inherits that fragility.
Where manual tracking breaks down
Five runs of ten draws is enough to teach the method and nowhere near enough to use it. Percentiles need volume: a 10th percentile from five runs is just the second-worst number you happened to draw. You need hundreds or thousands of runs before the tails stop jumping around, and that is not hand work.
The sample itself is harder to build than it looks:
- Missed rows. One closing transaction left out of the sheet removes a trade from the sample, or worse, leaves a position looking open so it never enters at all.
- Partial fills and partial closes. A position closed in three tranches is one trade, not three. Counted as three, you triple-weight it in every draw.
- Rolls. A short put rolled four times is one lifecycle. Treated as five separate trades, four tiny credits and one big outcome enter the sample as equals, and your pace looks five times faster than it is.
- Assignments. When a short put is assigned, part of the result moves into a stock holding. Stock holdings are not option trades, and mixing them in distorts both the P/L distribution and the trade count.
- Multiple accounts. Keeping separate sheets means separate samples, each too small to resample, with no easy way to pool them.
- Corrections. Relabel a position from a short call to a covered call, or split legs that were grouped wrongly, and every filtered sample built on the old labels is stale.
- Reproducibility. Hand-drawn runs cannot be repeated. Next month you cannot tell whether the range moved because your trading changed or because you rolled different dice.
There is also a quieter failure: resampling too few trades. Draw from eight results and the simulation mostly replays the same handful of outcomes, which makes the range look far tighter and more certain than your record justifies.
How MetisTrades does it
MetisTrades runs the same bootstrap on your imported closed trades. Go to Top nav → Analysis → Simulation. Simulation is a Pro feature; without active Pro access the tab shows a blurred placeholder with Trade-history simulation is a Pro feature and an Upgrade to Pro button, and no figures are computed. The sub-tab is never part of a public share page.
Setting the sample
The first row defines which trades get drawn. The account badge shows the scope from the header — All accounts or the selected account. The period picker defaults to All Time here, because the sample should be as large as possible, and it selects trades by exit date. Strategy, Symbol and Tag narrow it further; Strategy uses the same labels as the Closed Positions page, so a position you relabelled counts under its corrected strategy. The count on the right — N closed trades, or N closed trades of M in the period when a filter removed some — is your sample size.
A trade here is one option position from Closed Positions, with all its legs, rolls and partial closes rolled into a single result. Stock holdings are never counted. That is exactly the rule the hand method needed, applied for you.
Below 30 closed trades in the scope, the tab does not simulate. It shows Not enough closed trades to simulate, the count it found, and suggests widening the filters, the period, or picking All accounts.
Inputs
- Horizon — how far forward to simulate, in Months (default 12, up to 120) or Trades (up to 5,000). Months are converted at your pace, and the note beside the field shows the conversion, such as ≈ 41 trades at your pace.
- Runs — 500, 1,000 (default), 2,000, 5,000 or 10,000 simulated futures. More runs give steadier percentiles.
- Starting capital — used only to express drawdowns as a share of the account. It is prefilled from the account value for the scope when the app knows it; edit to override. With no value, dollar figures still show and percentages are withheld with a note.
- Run # and Re-roll — every run is seeded, so the same scope, inputs and run number always reproduce the same numbers. Re-roll advances the run number and draws a fresh set.
Runs are computed in a background worker, so the page stays responsive and shows a line such as Simulating run #1: 1,000 futures of 41 trades from 120 closed trades… while the first one computes.
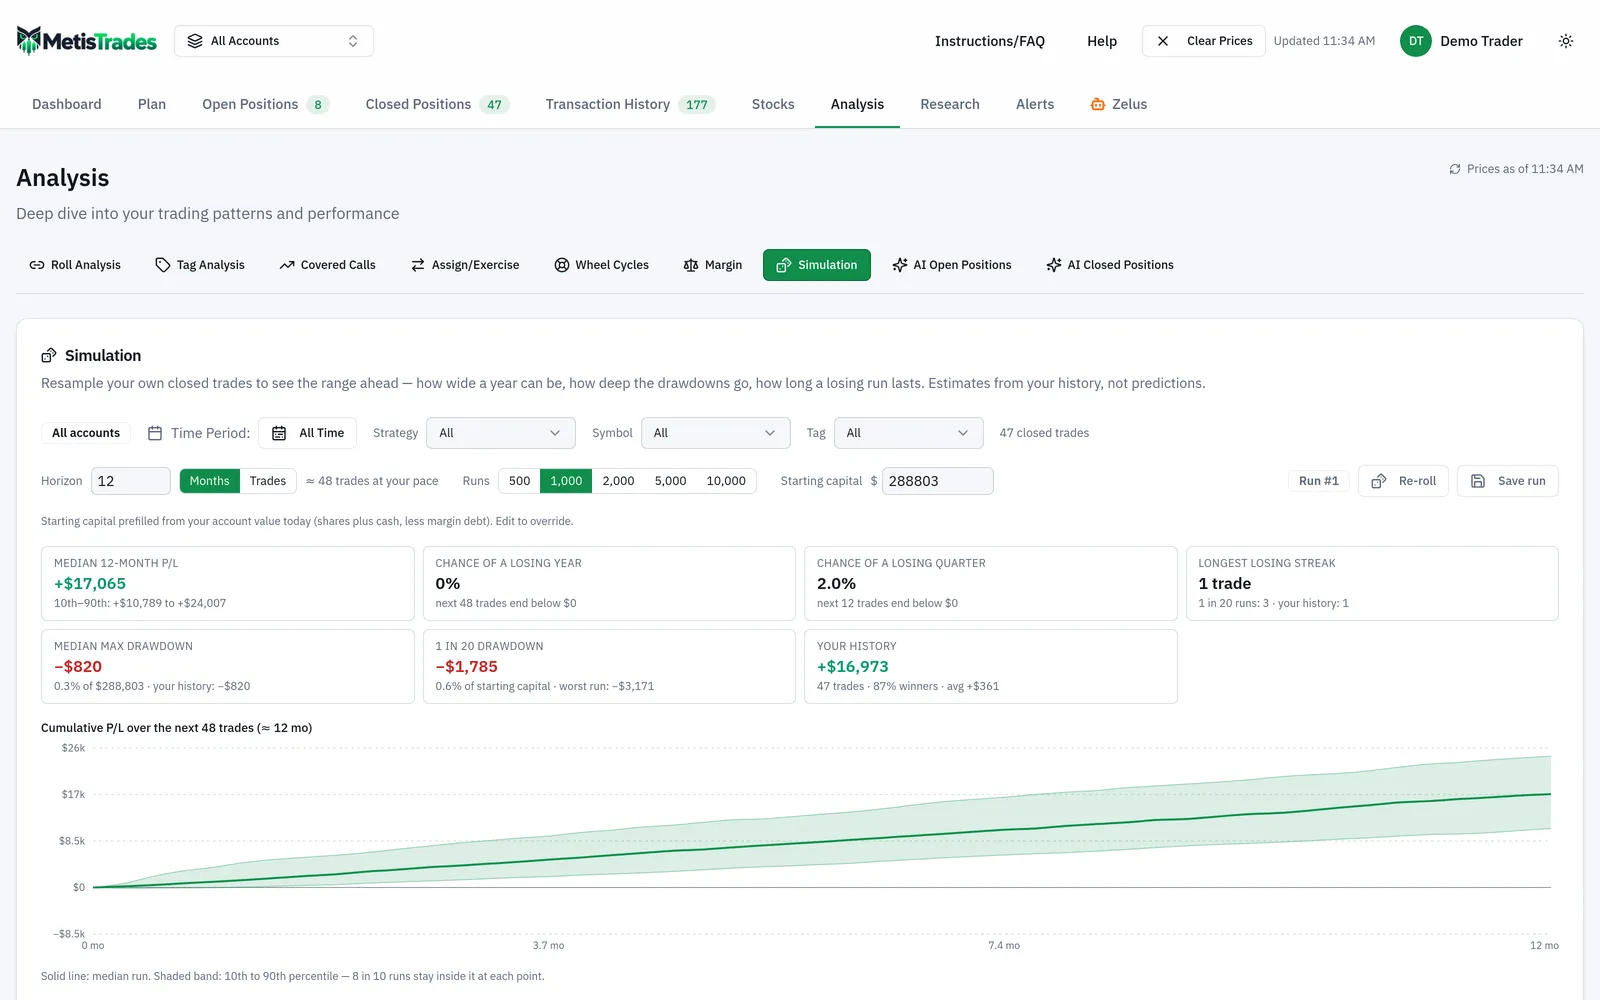
Once the run finishes, the result tiles and the charts beneath them carry the same quantities you calculated by hand — year-end P/L, drawdown, streak — across thousands of runs instead of five.
Tiles, charts and the outlier test
The tiles report Median 12-month P/L with its 10th–90th percentile range, Chance of a losing year, Chance of a losing quarter, Longest losing streak (the median, the 1-in-20 figure, and your actual history's longest beside it), Median max drawdown and 1 in 20 drawdown, each in dollars and as a share of starting capital, and the 1-in-20 drawdown also shows the single worst run. A Your history tile restates the sample's total P/L, trade count, win rate and average trade.
Three displays sit below. The Cumulative P/L fan draws the median run as a solid line and the 10th to 90th percentile at each point as a shaded band, so 8 in 10 runs stay inside it; the x-axis counts trades, labelled in months at your pace when the horizon is long enough for that to read naturally. The 12-month P/L histogram shows the share of runs landing in each band after a year's worth of trades, with solid red bars marking the worst 5%, and a Max drawdown histogram does the same for the deepest falls.
What made the difference is the automated version of step 5. Three columns — All trades, Without best k and Without worst k, where k is 5% of the sample (at least one trade) — run the same simulation with the same seed and only the sample changed, reporting sample size, median and 10th-percentile 12-month P/L, the chance of a losing year, and the median and 1-in-20 drawdowns. A note says how much your best and worst k trades made or lost out of your total.
Keeping a run
Save this run stores the inputs — account scope, period, filters, horizon, run count, starting capital and run number — plus the headline figures, never the thousands of paths, under a name you choose. A relative period is frozen on save, so This Year saved today becomes the exact days it covered. You can keep up to 50. Each saved row carries a sample label: Same sample as saved, or Sample changed since saved (X → Y closed trades). Load replays it and pins a Comparing with saved run panel with Saved, Live and Δ columns. Since the tab is never on a public share page, Copy puts a plain-text summary on the clipboard if you want to show someone a run.
Under the results, How this works restates the exact inputs — runs, horizon in trades, sample size, your pace with the first and last exit dates it was measured over, how many trades a year and a quarter are at that pace, how many trades had no readable exit date, and the run number and seed.
How to read the results
The median 12-month P/L is the middle outcome, not an expectation and not a forecast. Half the simulated years came in below it. Read it together with the 10th–90th band: in the hand example, a median of +$40 sitting inside a spread from −$330 to +$480 says the central figure carries very little information on its own.
The chance of a losing year is simply the share of runs whose first year's worth of trades added up to less than $0. It is a property of your recorded trade distribution, not a probability about markets. If it looks uncomfortably high next to a strong win rate, the explanation is usually loss size, as in the ten-trade sample where 70% winners still produced a $4 average trade.
Drawdown figures are about the path, not the destination. The median max drawdown is the typical deepest fall from a previous high; the 1-in-20 figure is the fall exceeded by one run in twenty. As a share of capital they depend entirely on the number in the starting capital field — the prefilled account value is today's estimate from delayed quotes and the cash ledger, so treat the percentage as approximate and override it when you know better.
The longest losing streak is the one tile most traders underestimate. In the hand example the record's longest streak was 1, but the median simulated streak was 2 and two of five runs hit 3. Your history has only had so many chances to produce a bad run; resampling gives it thousands.
The without best and without worst columns tell you how concentrated the result is. A narrow gap means the record is broad-based. A wide gap — like −$17.78 versus +$50.00 average trade in the hand example — means a few trades carry everything, and the median figures should be read with that in mind.
What none of it means: it does not price your open positions, model stock prices, or account for a change in your strategy mix, sizing or market conditions. It assumes future trades resemble past ones and that each trade is independent of the one before. All figures are estimates from a simplified model, not predictions or advice.
Common mistakes
- Treating the median as the expected result. It is the middle of a spread, and half the runs fall below it — quote it with the 10th–90th range or not at all.
- Simulating a filtered sample that is too small. Narrowing by strategy, symbol and tag at once can cut the sample to a handful of trades; widen the period or the filters, or pick All accounts, rather than reading a range built from almost nothing.
- Ignoring the without worst column. If dropping 5% of trades transforms the picture, the headline numbers rest on outliers — check that column before acting on the median.
- Re-rolling until the numbers look better. Re-roll draws a different random set with the same inputs; if the medians swing a lot between rolls, raise the run count or read the swing as a sign that a few trades dominate.
- Comparing a saved run without checking the sample label. Sample changed since saved means the same controls now select different trades, so the Δ column is measuring your data changing, not your range.
- Assuming an unchanged future. If you have doubled position size, switched strategies or started trading a different underlying, the sample describes a trader you no longer are.
- Trusting the percentage drawdowns blindly. They use whatever is in the starting capital field; set it to the figure you actually consider at risk.
Related guides and help pages
Related guides
- Monte Carlo simulation: what it is and where MetisTrades uses it
- Plan, Track, Optimize: a complete tour of MetisTrades
- How much capital does $1,000 a month in options income take?
- Analyzing closed-trade performance: win rate, expectancy and profit factor
- Reading your dashboard statistics: what each headline number actually measures
- Building a custom dashboard in MetisTrades