Setting personal portfolio risk limits and checking them against your open book
Concentration, sector, cash and leverage limits only work if you write them down and check them. Learn to size exposure and compare it with your limits by hand, then see how Plan → Risk does the same checks across your open positions.
What it is and why it matters
A risk limit is a number you decide in advance about how much of your portfolio any one thing is allowed to be. "No single symbol above 30% of the book." "No sector above 45%." "Never less than $20,000 in cash." That is it. The limit is not a prediction and not a trading signal. It is a rule you set while you are calm, so that you have something to check against when you are not.
The reason to write limits down is that concentration builds quietly. You sell a cash-secured put on a name you like — a short put backed by enough cash to buy the shares if you are assigned. It expires worthless, so you sell another. You buy a few more shares on a dip. You add a second technology name because the first one worked. Nothing about any single decision feels reckless, and six weeks later two symbols in the same sector are most of your risk.
To check a limit you need two things: a limit and an actual. The limit is yours to choose. The actual is an exposure number — how much money is at stake in each holding. For shares, exposure is the market value of the shares. For a short put you could be assigned on, the sensible exposure number is the cash it would take to buy the shares: strike × 100 × contracts, using the contract's real multiplier if it is not 100. A standard equity option usually represents 100 shares, but mini options use 10 and futures options use a broker-supplied multiplier, so check before you assume.
Sizing a short put at its assignment cost rather than its premium is the whole point of the exercise. The premium you collected might be $400. The obligation behind it might be $45,000. A risk board that only counts the $400 tells you nothing about what happens on a bad week.
Limits worth having usually cover five things: how much in one position, how much in one sector, how much cash you keep uninvested, how much you are borrowing against your holdings, and how directional the book is overall. This guide works through the first two by hand because they are the ones you can compute with a spreadsheet and a price. The rest need account balances, Greeks and a market reference, which is where software earns its place.
How to track it by hand
You need two sheets. One lists every holding with its exposure and your per-position limit. The second rolls those exposures up by sector and compares them with your sector limit. The worked example below is a four-holding book with a total exposure of $150,000, a per-position limit of 30%, and a sector limit of 45%.
Sheet 1: Holdings
One row per holding. Fill in Symbol, Sector, Exposure and Max position %. The last two columns are computed.
| Symbol | Sector | Exposure | Max position % | % of portfolio | Within limit? |
|---|---|---|---|---|---|
| XYZ | Technology | 60,000 | 30% | 40% | Over |
| ABC | Technology | 45,000 | 30% | 30% | OK |
| DEF | Health care | 30,000 | 30% | 20% | OK |
| GHI | Energy | 15,000 | 30% | 10% | OK |
| Total exposure | 150,000 |
The arithmetic is one division per row. Total exposure is 60,000 + 45,000 + 30,000 + 15,000 = 150,000. XYZ is 60,000 ÷ 150,000 = 0.40, or 40% of the book. Your limit is 30%, so 40% is above it and the row reads Over. ABC is 45,000 ÷ 150,000 = 0.30, exactly 30%. The test is whether the percentage is above the limit, not whether it touches it, so ABC reads OK — it is sitting precisely on the line. DEF is 30,000 ÷ 150,000 = 0.20 and GHI is 15,000 ÷ 150,000 = 0.10. Both are comfortably inside.
In the spreadsheet, with row r and the holdings block running from the first to the last row:
- % of portfolio:
=IF(A{r}="","",N(C{r})/SUM($C${first}:$C${last})) - Within limit?:
=IF(A{r}="","",IF(E{r}>N(D{r}),"Over","OK"))
The IF(A{r}="","") wrapper keeps blank rows blank so you can leave spare rows at the bottom without seeing errors, and N() treats an empty limit cell as zero rather than breaking the comparison.
Sheet 2: Sectors
One row per sector you hold, with your sector limit. Exposure here is summed from the Holdings sheet, so you never type a sector total by hand.
| Sector | Max sector % | Exposure | % of portfolio | Within limit? |
|---|---|---|---|---|
| Technology | 45% | 105,000 | 70% | Over |
| Health care | 45% | 30,000 | 20% | OK |
| Energy | 45% | 15,000 | 10% | OK |
| Total exposure | 150,000 |
Technology is XYZ's 60,000 plus ABC's 45,000 = 105,000, which is 105,000 ÷ 150,000 = 0.70, or 70% of the book against a 45% limit: Over, and over by a wide margin. Health care is 30,000 ÷ 150,000 = 20% and Energy is 15,000 ÷ 150,000 = 10%. The three sector percentages add to 100%, which is a useful sanity check that no holding has been misspelled into a sector that does not exist.
- Exposure:
=IF(A{r}="","",SUMIF(Holdings!$B:$B,A{r},Holdings!$C:$C)) - % of portfolio:
=IF(A{r}="","",C{r}/SUM($C${first}:$C${last})) - Within limit?:
=IF(A{r}="","",IF(D{r}>N(B{r}),"Over","OK"))
The SUMIF matches on the sector text, so "Health care" and "Healthcare" become two separate buckets and both will look smaller than they are. Use a dropdown list on the Holdings sector column if you can.
The worksheet below already contains this example and its formulas. Replace the four rows with your own holdings and your own limits.
Download the template: Portfolio risk limits worksheet (.xlsx). It opens in Excel, and in Google Sheets via File → Import. The worked example from this guide is already filled in, and the formulas carry down into the blank rows.
Two things this sheet deliberately does not do. It does not include cash in the denominator, so every percentage is a share of invested exposure. And it does not re-solve for what a trim would achieve: if you sold enough XYZ to bring it to 45,000, the total would fall to 135,000 and XYZ would then be 33% of the smaller book, not 30%. Cutting a concentration shrinks the denominator too, so recompute after any change rather than trusting the first subtraction.
Read the two sheets together. Nothing in the holdings sheet except XYZ looks alarming — three of four rows are fine, and ABC sits exactly on its limit. The sector sheet is where the real problem is: 70% of the book is one sector against a 45% limit. Per-position limits alone would have let this happen without a single red cell.
Where manual tracking breaks down
The arithmetic is easy. Keeping the inputs current is not, and a risk board built on stale inputs is worse than none because it reassures you.
- Missed rows. A worksheet only knows about holdings you typed. The put you sold on Friday afternoon is not in it, and that is usually the one that pushes a sector over.
- Partial fills. You sold five contracts and three filled. Unless you go back and amend the row, the exposure is overstated by 40% for that holding, and every percentage in both sheets is wrong with it.
- Rolls. Rolling closes one option leg and opens a replacement at a different strike, expiration, or both. Roll a $150 put down to $140 and your assignment exposure drops by $1,000 per contract. Roll it up and it rises. Most people update the expiration in their notes and forget the strike drives the exposure number.
- Assignments. A short put assignment buys the shares at the strike. The put row should disappear and a shares row should take its place at roughly the same exposure. Do half the job and you either double-count the symbol or lose it entirely.
- Multiple accounts. A taxable account and an IRA can each look diversified while holding the same two technology names. Concentration is a property of the combined book, and combining by hand means maintaining a third sheet that is always one import behind.
- Prices move. Every percentage in both tables is a function of today's prices. The sheet is accurate on the day you fill it in and drifts every day after.
- Corrections. Sector labels change, a symbol you classified as Technology is really a fund, a trade was booked to the wrong account. Each correction means retyping rows in a file whose history you cannot audit.
- What the sheet cannot hold. Cash balances, margin debt, directional exposure and buying power committed to short options all matter to risk and none of them fit neatly in a two-sheet concentration worksheet.
How MetisTrades does it
Plan → Risk is the same exercise, run against your imported open positions. You need a signed-in account with app-wide Pro access to see it; an anonymous visitor sees Sign In Required instead of the risk board, and a signed-in user without active access is redirected to Account Settings.
Setting your targets
The Portfolio risk targets card holds eight number fields: Max per position, Max per sector, Minimum cash reserve, Beta delta minimum, Beta delta maximum, Max short-option BP, LTV return target and LTV comfort ceiling. Edit a field and leave it; the value saves immediately and there is no separate Save button.
The defaults are Max per position 25%, Max per sector 40%, Minimum cash reserve $0, Beta delta minimum −100, Beta delta maximum 100, Max short-option BP 50%, LTV return target 10% and LTV comfort ceiling 15%. For the worked example you would type 30 and 45 into the first two fields. The percentage concentration fields accept 1% through 100%, Minimum cash reserve accepts $0 through $1 billion, Max short-option BP accepts 0% through 100%, and the beta minimum must be below the beta maximum. An invalid value shows a validation message and is not saved.
The two LTV values are the same settings used by Analysis › Margin, where they appear as Target LTV % and Soft limit %. Change one here and it changes there.
The six risk cards
Below the targets, six cards compare the latest available actuals with those targets: Largest position, Largest sector, Cash reserve, LTV comfort band, Beta-weighted delta and Short-option buying power. Each shows an actual, a Target: line, a source note, and a badge: In bounds, Out of bounds or Unknown. An out-of-bounds card is highlighted and shows a suggested reduction, cash addition or margin paydown. The two concentration cards also name the position or sector behind the percentage, so you see which symbol and which sector, not just a number.
Every target field, every risk card and every setting and figure on the two stress cards carries a small ? beside its label. Hover, tab to it, or tap it on a phone for a plain-English explanation of the limit, its units, where the actual comes from, and what a breach means. The screenshot below shows the board with targets at the top and the dials underneath — look at how each card pairs an actual with its target line.
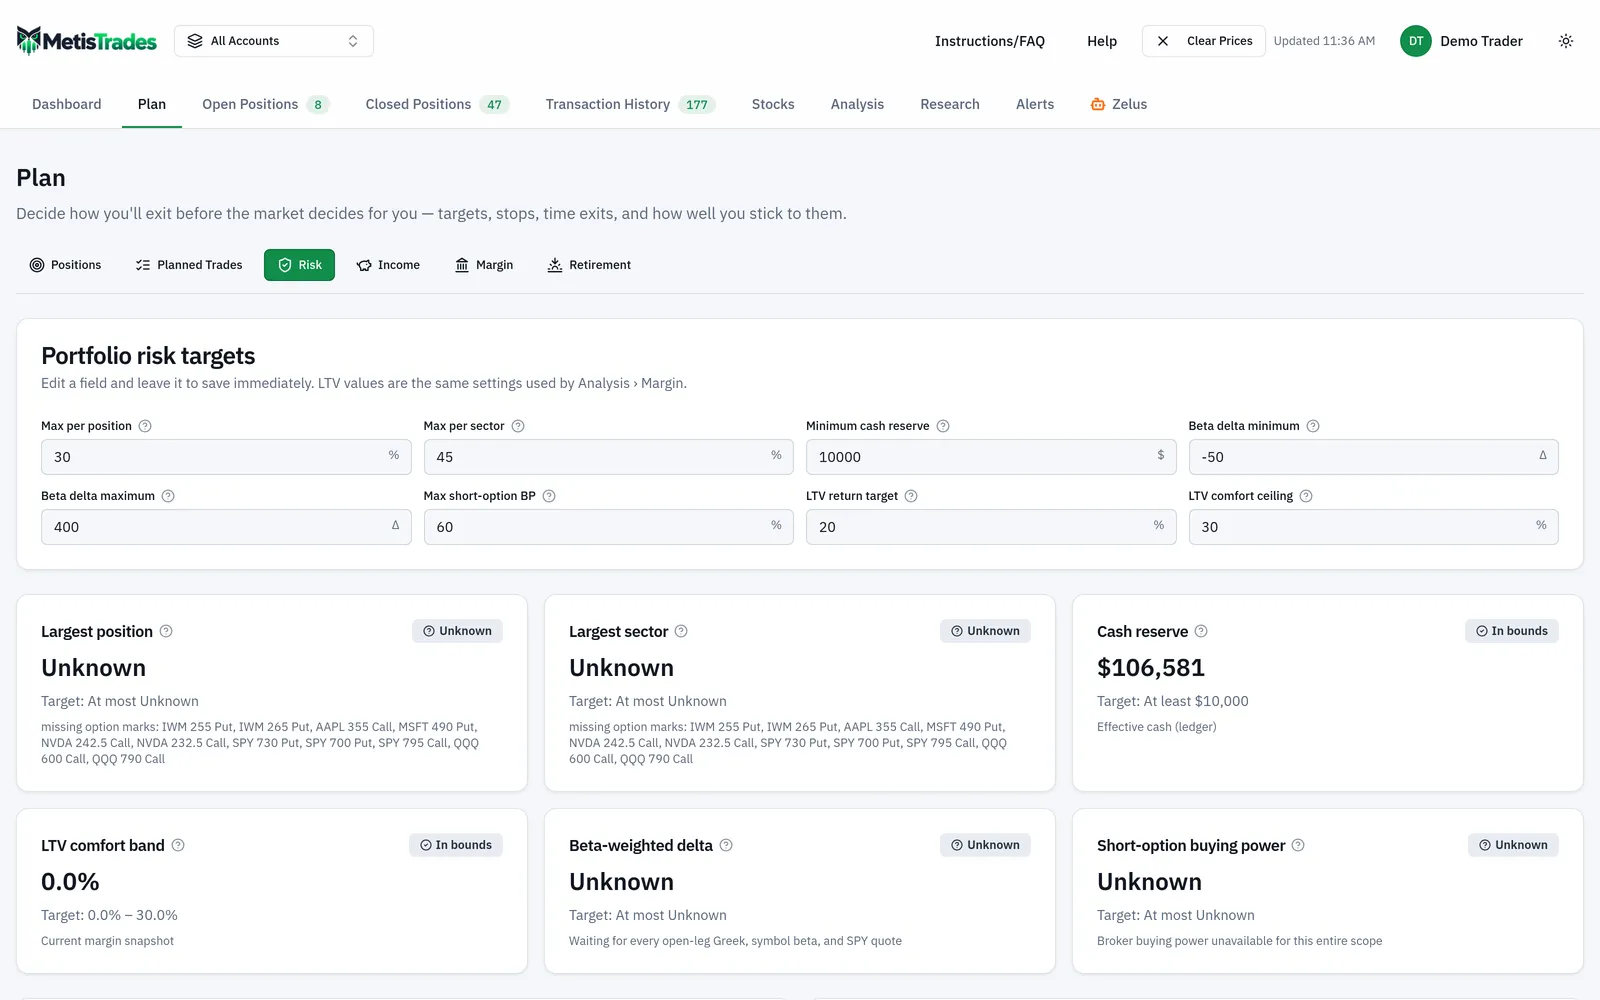
The board covers the selected trading account, or the combined open book in All Accounts. It does not change when you change a Dashboard period filter, because concentration is a snapshot of what you hold now rather than a period result.
What if the market moves?
Underneath the cards, the What if the market moves? card reprices every open position in the selected scope for a set of market shocks and shows which targets would flip out of bounds. There is one row per market move — −20%, −10%, −5%, 0%, +5%, +10% — plus a Custom row where you type your own market move, IV shift and days forward, within ±90%, ±200 IV points and 0–365 days. Two selectors apply to the preset rows: IV shift (−10, 0, +10 or +25 implied-volatility points) and Days forward (0, 7 or 30 days).
Each row reports Total P/L vs today in dollars, Beta-wtd Δ after, and Risk targets — the dials that change versus the model's own no-move baseline, marked → out, still out or back in, with No new breaches when nothing moves. Expand a row with the chevron to see every position's P/L for that scenario, worst first, with each symbol's today → scenario price.
Every symbol moves by its beta × the market move; a symbol with no beta on file moves 1:1 with the market and is named in the footer. Options are repriced with a Black-Scholes model at their current mark-implied volatility plus the IV shift. Only four dials can move with prices — Largest position, Largest sector, LTV comfort band and Beta-weighted delta — while Cash reserve and Short-option buying power are carried from today unchanged. Positions that cannot be repriced are listed under the grid with the reason and excluded from every figure, never counted as $0.
The card runs from the quotes already loaded on the page and never fetches prices on its own. If no quotes are loaded it asks you to Refresh quotes. Quotes in MetisTrades are delayed, so treat every figure as an estimate from the last available marks.
Simulation
Next to the What-if card, the Simulation card is a portfolio Monte Carlo: instead of six fixed shocks it draws thousands of random market paths and reprices the book at the end of each one. You choose a Horizon (7d, 14d, 30d, 60d or Nearest exp), a number of Paths (1,000, 2,500 or 5,000) and a Vol source (Implied or Realized). Every run is seeded, so the same inputs and run number reproduce the same figures, and Re-roll starts a fresh set of draws. This card is for Pro accounts; without active access it shows the controls and a Portfolio simulation is a Pro feature prompt.
How to read the results
Largest position is the largest positive single-symbol exposure as a percentage of total positive allocated value. Allocated value is the total of positive stock, long-option and cash buckets — so cash is in the denominator here, unlike the worksheet, and open short options are liabilities that are not added to that positive total. A book that looks 40% concentrated in the worksheet can read lower on the card simply because cash is counted. It is out of bounds only when the percentage is above Max per position.
Largest sector uses the same denominator plus completed company-profile lookups. Cash, ETFs & funds and Unclassified are not treated as economic sectors, and the card does not look through a fund to its underlying holdings. If a broad technology ETF is a large part of your book, it will not appear in the sector comparison — a gap worth remembering when the card says you are in bounds.
Unknown is a real answer, not a failure. The board refuses to calculate a partial actual when a required quote, option mark, company profile, beta, Greek, account balance or buying-power value is unavailable. Read the source note on the card for the immediate reason. Largest position needs a current quote for every included stock holding and a current mark for every open option leg, which is why it can read Unknown while a portfolio value appears elsewhere — other views can fall back to imported cost or booked premium, and this card will not.
Cash reserve uses a broker balance when available and the reconstructed transaction ledger otherwise. LTV comfort band is margin debt divided by collateral value, where margin debt is the amount by which effective cash is negative and collateral is stock value plus positive cash; when it breaches, the suggestion estimates the outside cash needed to return to LTV return target.
Beta-weighted delta converts stock and open-option delta into an approximate number of SPY-equivalent shares. It is a directional approximation, not a complete risk model, and when futures or futures options are held it reads Unknown. Short-option buying power divides buying power committed to positions with an open short option by broker-reported buying power, using your saved Buying Power at Open amounts where they exist. Those amounts and the broker figure can come from different points in time, so read it as a planning comparison rather than an account guarantee.
On the stress cards, note what the numbers are not. A What-if row is a model: constant implied volatility within each scenario, every symbol moved by beta × the market move, no dividends, early assignment, interest changes or liquidity. The 0% row is only a true baseline when IV shift is 0 and Days forward is 0; with either selected it isolates volatility and time passing with no market move. Simulation percentiles carry sampling noise that shrinks with more paths — figures moving between re-rolls is the model resampling itself, not news about your book.
Finally, the badges describe your own limits. They are personal planning limits, not broker margin-call or liquidation thresholds, and the suggested dollar changes are approximate and rounded to whole dollars.
Common mistakes
- Sizing a short put by its premium instead of its assignment cost. Use strike × contract size × contracts, with the contract's real multiplier. The $400 credit is not the risk; the $45,000 obligation is.
- Setting limits only per position and never per sector. The worked example passes three of four position checks while 70% of the book sits in one sector. Keep both tests.
- Assuming a trim to the limit holds. Cutting a position shrinks the total too, so the percentage after the trade is not the one you solved for. Recompute both sheets after any change.
- Treating Unknown as In bounds. An Unknown card means an input is missing, not that the dial is fine. Read the source note, refresh quotes if it asks, and check the dial again.
- Forgetting that a fund hides its sector. ETFs and unclassified symbols are excluded from the Largest sector comparison and are not looked through, so a fund-heavy book can be more concentrated than the card shows.
- Checking one account when you trade several. Concentration is a property of the combined book. Use All Accounts when you want the honest number, and a single account when you want to act on it.
- Reading a What-if or Simulation figure as a forecast. Both are read-only models with fixed assumptions. They tell you which dials are fragile, not what the book will be worth.
Related guides and help pages
Related guides
- Monte Carlo simulation: what it is and where MetisTrades uses it
- Plan, Track, Optimize: a complete tour of MetisTrades
- How much capital does $1,000 a month in options income take?
- Planning Your Portfolio: A Tour of the Plan Tab
- Exit plans: deciding how you will leave a trade
- Setting and Tracking an Options Income Goal