Keeping a Clean Transaction Ledger: Your Portfolio's Source of Truth
Every position, P/L figure and tax estimate you look at is built from individual activity rows. Here is how to keep that ledger by hand, and how Transaction History in MetisTrades searches, groups, annotates and corrects the same rows.

What it is and why it matters
A transaction ledger is a list of every single thing that happened in your brokerage account, one line per event, in date order. An option sold to open is a line. The fee attached to it is part of that line. A dividend is a line. So is a deposit, a withdrawal, a margin interest charge, an assignment, and an option that expired worthless.
The ledger is not a summary of your trades. It is the raw material that every summary is built from. Your open positions are a view of ledger rows that have not been closed yet. Your realized profit and loss is arithmetic on ledger rows. Your cost basis, your holding periods, your wheel cycles, your roll chains, your net premium for the year — all of them are derived. If a row is missing, wrong, or duplicated, every number downstream of it is wrong too, and usually in a way that looks perfectly reasonable on screen.
That is the reason to treat the ledger as the source of truth and everything else as a report. When a position looks strange — a cost basis that does not match what you remember paying, a closed trade showing the wrong profit — the fix is almost never in the summary. It is in a row.
Three ideas do most of the work in a ledger, and they are worth getting straight before you write anything down.
Amount is signed cash. A positive amount is money that arrived in the account; a negative amount is money that left. Selling a put to open brings cash in, so its amount is positive. Buying that put back sends cash out, so its amount is negative. You do not need a separate column for direction, because the sign carries it.
Code says what kind of event it was. Brokers use short codes: STO for sell to open, BTC for buy to close, OASGN for an option assignment, CDIV or DIV for a cash dividend, ACH for a deposit, INT for interest. The codes vary between brokers, and that is fine as long as you copy whatever yours uses consistently.
Fees are already in the amount, usually. Most statements report the net cash effect of a trade with commission and fees already subtracted. If you also recompute quantity times price and subtract fees again, you will double-count them. Copy the amount from the statement.
How to track it by hand
A ledger you keep by hand needs nine columns and one formula. Here is a short worked example covering two months: a deposit, one short put opened and later bought back, a dividend, and an interest credit.
Each row is one activity line exactly as the broker reported it. The Cash balance column is the only computed one — it is a running total of Amount from the first row down to the current row.
| Date | Symbol | Code | Description | Quantity | Price | Amount | Note | Cash balance |
|---|---|---|---|---|---|---|---|---|
| 2026-01-02 | ACH | Deposit | 10000 | 10000 | ||||
| 2026-01-05 | XYZ | STO | XYZ 2026-02-20 50 put | 1 | 1.5 | 149.35 | Fee 0.65 already netted | 10149.35 |
| 2026-01-15 | ABC | CDIV | Cash dividend | 24 | 10173.35 | |||
| 2026-02-03 | XYZ | BTC | XYZ 2026-02-20 50 put | 1 | 0.4 | -40.65 | Closed early | 10132.7 |
| 2026-02-28 | INT | Interest on cash | 3.1 | 10135.8 |
Walking the rows
The 2026-01-02 ACH row is a 10,000 deposit. No symbol, no quantity, no price — cash movements have none of those. The running balance starts at 10000.
The 2026-01-05 STO row is one XYZ 50-strike put expiring 2026-02-20, sold to open at 1.50 per contract. One standard equity contract represents 100 shares, so the gross premium is 1.50 × 100 = 150.00. The broker charged 0.65 in commission and fees, so the cash that actually landed was 150.00 − 0.65 = 149.35. That is what goes in Amount, and the note records why the amount does not equal quantity times price. The balance becomes 10000 + 149.35 = 10149.35.
The 2026-01-15 CDIV row is a 24.00 cash dividend on ABC shares. It has a symbol but no quantity or price, because the ledger is recording a cash event, not a trade. Balance: 10149.35 + 24 = 10173.35.
The 2026-02-03 BTC row closes the put early at 0.40. The contract costs 0.40 × 100 = 40.00 to buy back, plus 0.65 in fees, so 40.65 leaves the account. The amount is recorded as −40.65, negative because cash went out. Balance: 10173.35 − 40.65 = 10132.70.
The 2026-02-28 INT row is 3.10 of interest paid on the idle cash. Balance: 10132.70 + 3.10 = 10135.80.
The formula and the totals
Only one column needs a formula. With Amount in column G and the first data row numbered {first}, each Cash balance cell is:
=IF(A{r}="","",SUM($G${first}:G{r}))
The IF keeps blank rows blank so the column does not trail a wall of repeated numbers below your last entry. Everything else is typed in from the statement.
From those five rows you can read four figures directly. Net cash is 10135.80, matching the last balance. Option trades — the STO and BTC rows together — come to 149.35 − 40.65 = 108.70, which is what the put actually earned after both commissions. Dividends total 24. Rows is 5. If your broker's statement says the account holds 10,135.80 in cash at the end of February, your ledger is complete. If it does not, something is missing and you now know to go looking.
That reconciliation is the whole point of the cash balance column. It is a checksum. A ledger that ties out to the broker's cash figure is a ledger you can build on.
The spreadsheet below contains this example, the Cash balance formula and the totals already set up, so you can delete the sample rows and start entering your own.
Download the template: Transaction ledger spreadsheet (.xlsx). It opens in Excel, and in Google Sheets via File → Import. The worked example from this guide is already filled in, and the formulas carry down into the blank rows.
Where manual tracking breaks down
Five rows is easy. The trouble starts at a few hundred, and it is rarely the arithmetic that fails.
Rows go missing. Expirations are the classic case: nothing happened, no cash moved, so there is nothing on the statement that catches your eye. But the position is gone, and a ledger that never records the expiry still shows it open. Assignments are worse, because one event produces two rows — the option leaving and the shares arriving — and it is easy to capture one and not the other.
Partial fills multiply rows. You sold five contracts; the broker filled three at one price and two at another, as two separate lines with two separate fee amounts. Collapsing them into one hand-written row loses the actual fill prices and usually gets the fees slightly wrong.
Rolls look like two unrelated trades. A roll is a buy to close and a sell to open, often on the same day. In the raw ledger they are just two rows. The relationship between them — that this short put is the continuation of that one — exists only in your head unless you write it down somewhere.
Corrections break your audit trail. You find an error from six weeks ago and fix the amount. Now the running balance changes for every row after it, which is correct, but you no longer have a record of what the broker originally reported versus what you decided it should say.
Multiple accounts do not add up cleanly. One sheet per account keeps the cash balances honest but makes any portfolio-wide question — total premium this year, total dividends — a manual stitching job. One combined sheet makes the portfolio question easy and the per-account reconciliation impossible.
Re-entering a period duplicates it. You download the statement again to catch a late correction, paste the month in, and now half of January appears twice. The cash balance drifts and the dividend total quietly doubles.
Corporate actions are not cash events. A stock split arrives as two zero-dollar lines — shares leaving under one identifier, shares arriving under another. Neither changes the cash balance, so neither affects your checksum, and a ledger that ignores them keeps counting the pre-split share count forever.
How MetisTrades does it
Transaction History is the same ledger, kept for you. It lives at /transactions, reached from Top nav → Transaction History, and each row represents one recorded activity item: an option trade, stock trade, dividend, deposit, withdrawal, fee, assignment, expiration, or exercise.
Finding the row you want
The first thing to notice on the page is how you narrow it down. The search field — labelled Search positions... even here — matches the displayed symbol, the transaction description, or the transaction code, ignoring capitalization. Filter icons sit in the Symbol, Date, Expiration, Type, Trans Code and Strategy Tag column headers. The Date filter offers presets from Today through Last 1 year plus a custom range. When any search or filter is active, the page shows Clear All Filters and an Active filters: row so you always know what you are looking at.
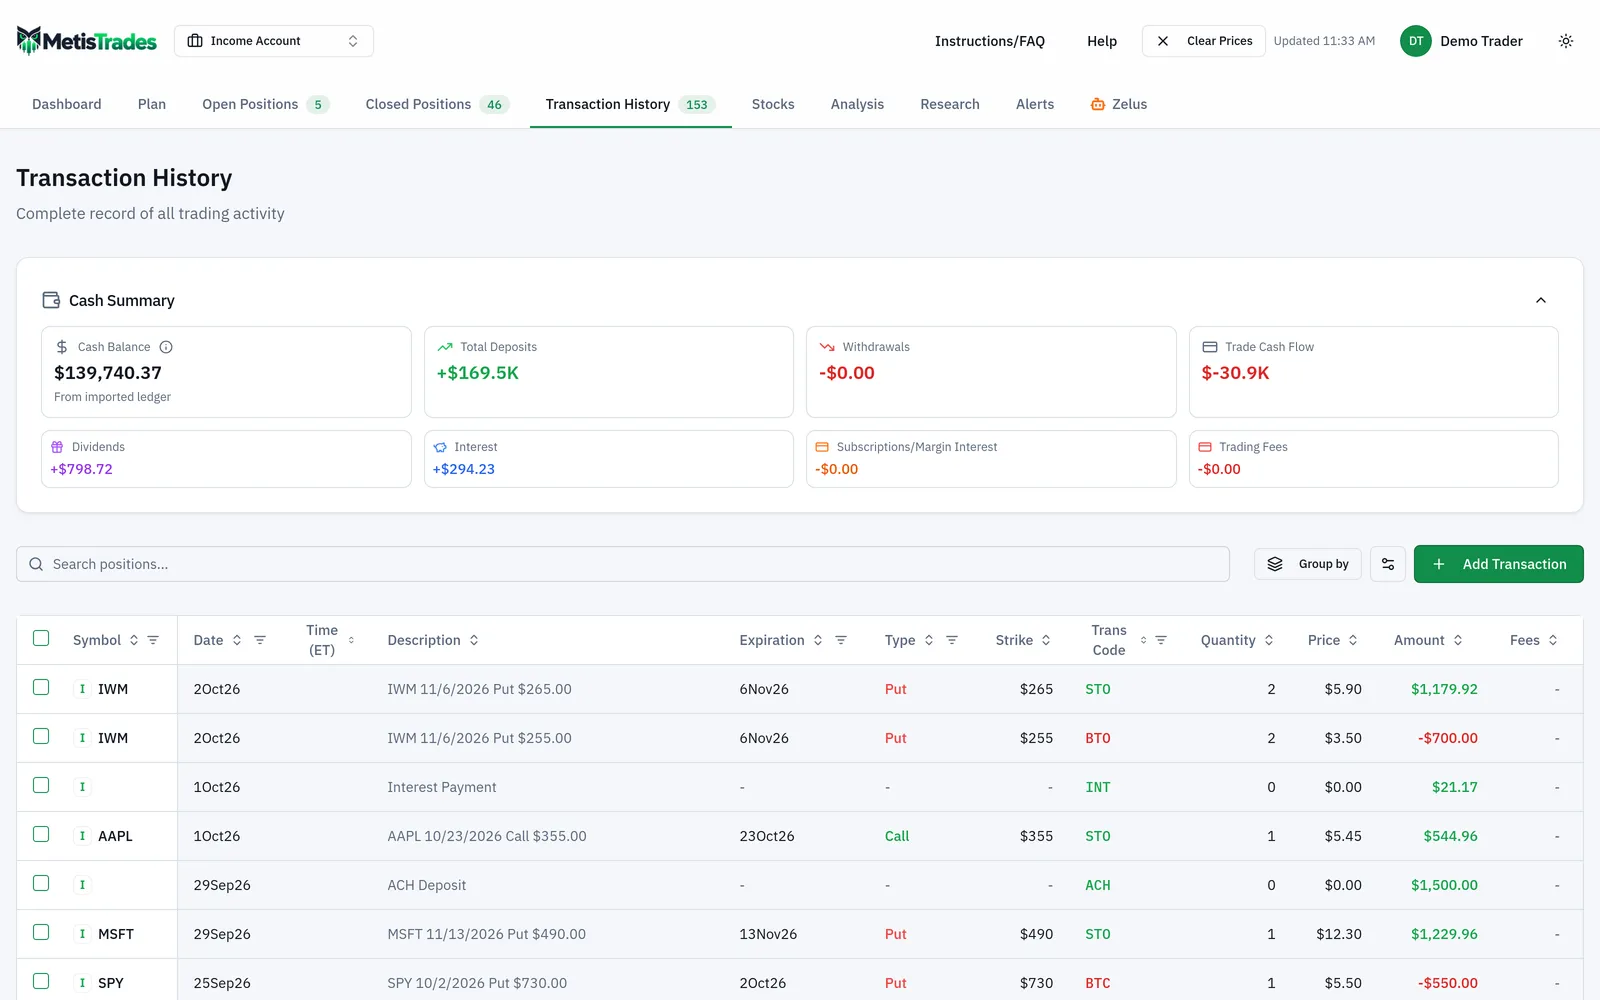
Group by reorganizes the display without changing any data: by Symbol, Date, Expiration Date, Type, Strike, Trans Code, or Trading Account. You can stack more than one level and reorder the numbered grouping chips. Groups start collapsed, and group headers show row counts with subtotal Amount and Fees. Note that pagination is turned off while grouping is active; clear the grouping to go back to pages of up to 100 rows.
Reading a row
The columns map closely onto the hand ledger: Symbol, Date, Time (ET), Description, Expiration, Type, Strike, Trans Code, Quantity, Price, Amount, Fees, Strategy Tag and Notes. Amount is the signed dollar effect, green when nonnegative and red when negative — the same convention as the 149.35 and −40.65 rows above. Hovering the Fees value splits it into commission and fees separately, which is the detail a hand ledger usually loses.
Beside each symbol is a source badge: I for an imported transaction, S for a SnapTrade synced row, M for one you entered yourself. That badge is the audit trail the spreadsheet does not have.
Adding, correcting and annotating
When you are signed in and viewing a specific account, Add Transaction opens Add Manual Transaction. You pick a Date and Transaction Type first, then enter Amount for cash activity, or Symbol, Quantity and Price per Share/Contract for a trade, with optional Commission and Fees. Turning on This is an option adds Expiration, Strike and Type; choosing an option transaction type turns it on for you. An equity option shows Equity option — ×100 per contract and a Total premium preview, which is the 1.50 × 100 = 150.00 arithmetic done in the dialog.
The same dialog's Multi-leg position tab records a whole spread — every leg plus its strategy label — in one save, with no grouping step afterwards.
The pencil button opens Edit Transaction; the trash button opens Delete Transaction. Editing an imported or synced row warns you first, because the edited version no longer matches the original for duplicate detection on a re-upload. Deleted rows go on the account's Removed Transactions list, so a later import or sync will not quietly bring them back.
The speech-bubble button in Notes opens Trade Notes for that row. This is where "Closed early" and "Fee 0.65 already netted" live. You can add several notes to one row; the badge shows the count, displayed as 9+ above nine.
Selecting at least two rows, including at least one BTO or STO opening transaction, offers Group as Position, which previews Total Credit, Total Debit and Net P/L before you create the grouping.
Splits and duplicates
Where the broker files a split as two zero-dollar rows and MetisTrades can prove the pair, it treats them as one split: both broker rows stay in the table badged Split out and Split in, and a Stock splits panel above the table states the event, for example a 1-for-50 reverse split taking 1,000 shares to 20. Splits it recognized but could not apply are listed there too, with the reason.
Duplicate review happens at upload, not on this page. When an upload may repeat rows already in the account, Potential Duplicates Found shows the match reasons and match percentage, and you choose Skip Duplicates (N), Import All Anyway, or Cancel.
How to read the results
For one signed-in account the page can show a collapsible Cash Summary above the ledger, with cards for Cash Balance, Total Deposits, Withdrawals, Trade Cash Flow, Dividends, Interest, Subscriptions/Margin Interest and Trading Fees, plus Other Activity when it is not zero. These are the same buckets the worked example produced by hand: 10,000 of deposits, 108.70 of trade cash flow, 24 of dividends, 3.10 of interest, 10,135.80 of cash.
Read Cash Balance with its source in mind. For an anonymous upload or a public share it is calculated from the available transaction ledger — the same running sum you built. A signed-in brokerage-connected account may instead show a broker-reported cash balance, with Cash balance details explaining which. A derived balance is only as complete as the rows behind it; a broker-reported one is the broker's own figure.
The totals row at the bottom shows Totals · N rows and the sum of Amount for the rows left after column filters. That last part matters. Filter to Trans Code STO and BTC for one symbol and the total is that symbol's option cash flow; clear the filter and it is everything. The number always means "the sum of what is currently visible", never "the sum of the account".
Scope is the other half of reading these figures. With all accounts selected the table adds an Account column identifying which trading account owns each row, and the totals cover all of them together.
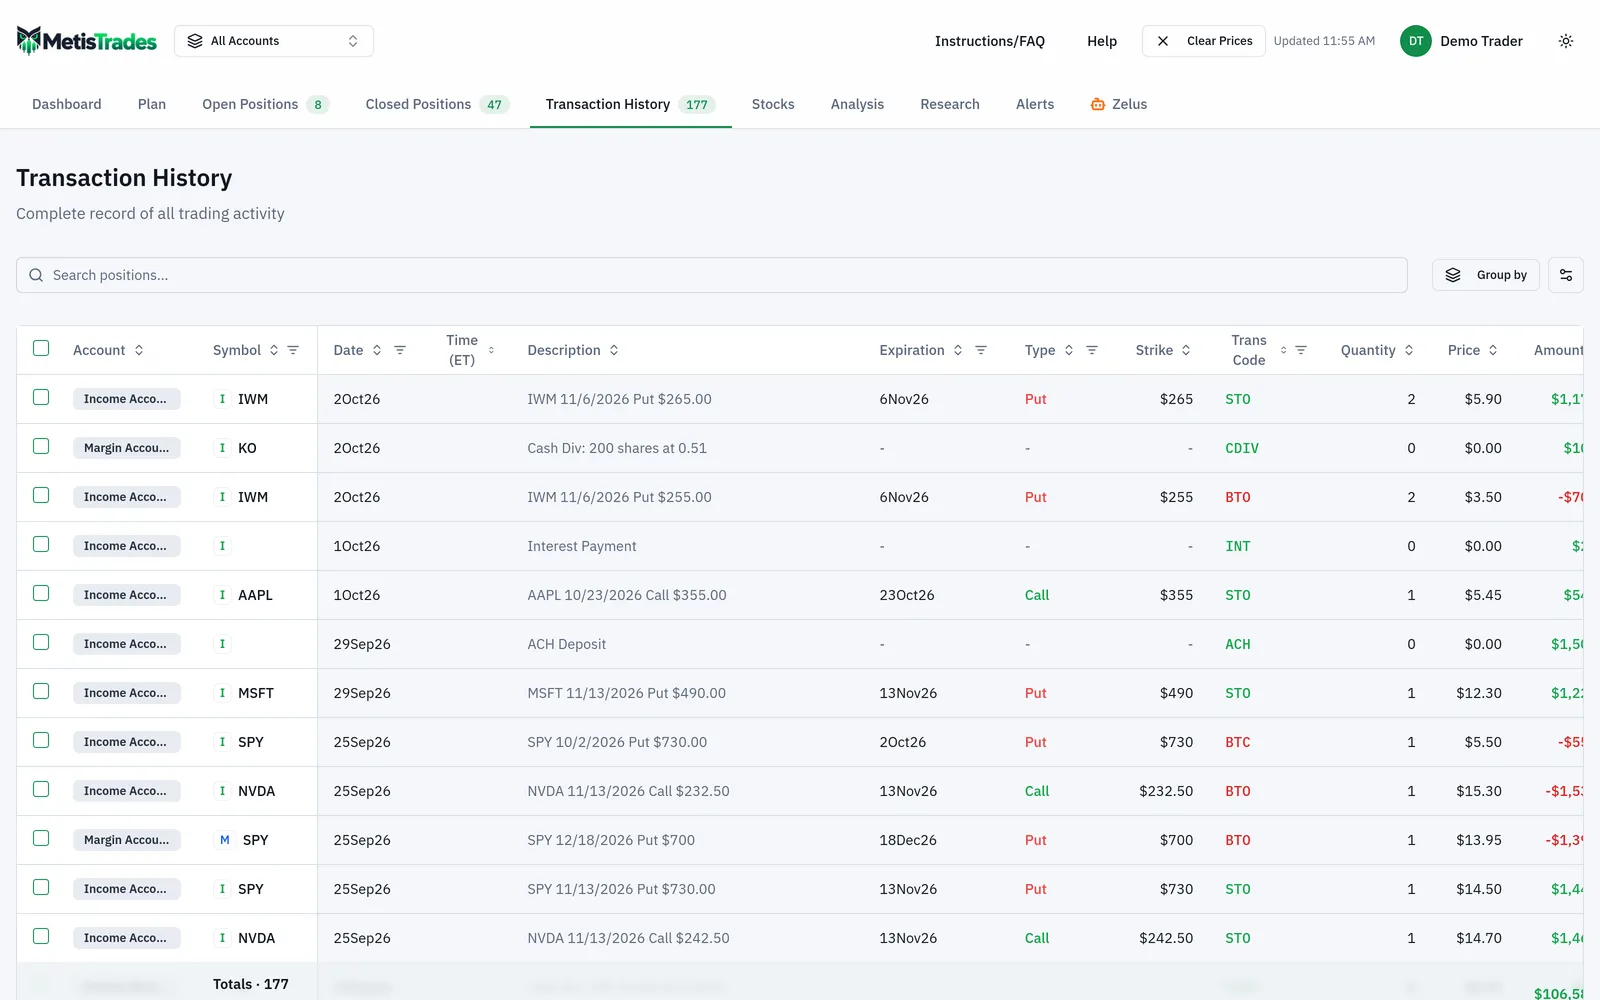
All Accounts is a reading view. Row edit and delete controls are hidden there and Group as Position is disabled, so corrections mean selecting a single account first.
Two things these numbers are not. They are not executable prices: quotes in MetisTrades are delayed, and the mid or mark hints in the add-transaction dialogs are estimates of the market at the time the chain was assembled, not your fill — record the price your broker reports if it differed. And they are not tax figures. Anything derived from imported transactions is an estimate; tax-related figures are not tax advice and not a substitute for your broker's 1099-B.
Access differs by tier. An anonymous visitor who has uploaded transactions can use the full Transaction History tab for that browser-session data, but cannot add, edit, delete, group or annotate rows. The full signed-in page requires Pro. Public share viewers get a read-only Transactions tab with no notes or modification controls.
Common mistakes
- Recomputing the amount instead of copying it. Quantity × price × 100 ignores commission, and subtracting fees a second time double-counts them. Copy the signed amount from the statement and let quantity and price stay as reference.
- Leaving out the zero-cash rows. Expirations, assignments and splits move no money, so they never break your cash reconciliation — and they are exactly the rows whose absence leaves phantom positions open. Enter them deliberately.
- Collapsing partial fills into one line. Two fills at two prices with two fee amounts are two rows. Merging them loses the real prices and usually misstates the fees.
- Expecting search to find a date or a strike. Search checks the displayed symbol, description and transaction code only. Use the Date, Expiration, Type, Trans Code and Strategy Tag column filters for everything else.
- Reading the totals row as an account total. It sums the rows left after your filters. Clear filters before quoting a figure as a portfolio number.
- Trying to fix a row in All Accounts. Edit, delete and Group as Position are unavailable there. Switch to the single account that owns the row first.
- Deleting a row to silence a duplicate, then re-uploading. Deleted rows go on Removed Transactions and stay skipped; Allow again in Account Settings → Data & Uploads only clears the block, and you still have to upload or sync again to bring the row back.
Related guides and help pages
Related guides
- Tags and Notes: Adding Your Own Context to Positions
- Tracking the Wheel Strategy: Premium, Share Basis and the Cycle Result
- Understanding Roll Chains: Tracking a Rolled Option as One Trade
- Tracking covered-call income by symbol
- Tracking assignments and exercises: shares, basis and what happened next
- Keeping Track of Open Positions: Legs, Days to Expiry and Mark-to-Market P/L