Tracking the Wheel Strategy: Premium, Share Basis and the Cycle Result
Follow one full wheel — cash-secured put, assignment, two covered calls, shares called away — and learn to track premium, share basis and break-even by hand. Then see how MetisTrades links the same activity into a single cycle.
What it is and why it matters
The wheel is a repeating sequence of trades around one stock. You sell a cash-secured put — a put you have sold, backed by enough cash to buy the shares if you are required to. If the stock falls below the strike and the put is assigned, you buy 100 shares per contract at the strike. You then sell covered calls against those shares: short calls backed by stock you already own. If a call is assigned, the shares are called away — sold at the call strike — and you are back to cash, ready to start again.
Four separate things happen here: an option trade, a stock purchase, one or more further option trades, and a stock sale. Brokers report them as four or five unrelated lines. That is the problem this guide solves.
Measured one contract at a time, a wheel tells you very little, and sometimes tells you the wrong thing. Take the example below. The put collected $149.35 and then got assigned — was that a win or a loss? The second covered call collected $89.35 and was assigned, forcing a stock sale — a "loss" by the usual option-trader reflex, even though it closed the cycle at a profit. Neither question has a sensible answer on its own.
The unit worth measuring is the cycle: everything from the first put sale to the moment the last share leaves the account. Within a cycle, three numbers matter and only make sense together:
- Premium to date — every option credit you have collected, minus anything paid to close, minus fees.
- Break-even per share — what the shares effectively cost you once that premium is subtracted. This is the number that tells you whether a given call strike locks in a gain.
- Cycle result — total premium plus the stock gain or loss, which is the only figure that says whether the whole exercise was worth the capital you tied up.
None of this makes the wheel safe. Assignment happens when the stock moves against you, and holding 100 shares after a put assignment is a real, unhedged stock position. Tracking the cycle does not reduce that risk; it just makes the result honest.
How to track it by hand
Use one row per event, not per trade ticket. An assignment is an event. An expiration is an event. Each row carries the running totals forward, so you can read your break-even at any point in the cycle without recalculating from scratch.
The columns
Record these for each row: Date, Event, Contracts, Strike, Premium / share (positive when you collect it, negative when you pay to close), Fees, and Shares +/− (positive when shares arrive, negative when they leave).
Six columns are then computed:
- Option cash = contracts × premium per share × 100 − fees
- Stock cash = −(shares +/−) × strike, so buying shares is negative and selling is positive
- Shares held = running sum of Shares +/−
- Premium to date = running sum of Option cash
- Net cash to date = running sum of Option cash and Stock cash together
- Break-even / share = −Net cash to date ÷ Shares held, shown only while you hold shares
The spreadsheet below already contains this worked example and the formulas for every computed column, so you can overwrite the rows with your own trades.
Download the template: Wheel tracker spreadsheet (.xlsx). It opens in Excel, and in Google Sheets via File → Import. The worked example from this guide is already filled in, and the formulas carry down into the blank rows.
The worked example
One contract of XYZ, a 50-strike put, sold on 5 January 2026 and finished on 20 March 2026.
| Date | Event | Contracts | Strike | Premium / share | Fees | Shares +/− | Option cash | Stock cash | Shares held | Premium to date | Net cash to date | Break-even / share |
|---|---|---|---|---|---|---|---|---|---|---|---|---|
| 2026-01-05 | Sell 1 XYZ 50 put | 1 | 50 | 1.5 | 0.65 | 149.35 | 0 | 0 | 149.35 | 149.35 | ||
| 2026-01-16 | Put assigned: buy 100 at 50 | 50 | 100 | 0 | -5000 | 100 | 149.35 | -4850.65 | 48.5065 | |||
| 2026-01-20 | Sell 1 XYZ 52 call | 1 | 52 | 1.2 | 0.65 | 119.35 | 0 | 100 | 268.7 | -4731.3 | 47.313 | |
| 2026-02-20 | Call expires worthless | 0 | 0 | 100 | 268.7 | -4731.3 | 47.313 | |||||
| 2026-02-23 | Sell 1 XYZ 52 call | 1 | 52 | 0.9 | 0.65 | 89.35 | 0 | 100 | 358.05 | -4641.95 | 46.4195 | |
| 2026-03-20 | Call assigned: 100 called away at 52 | 52 | -100 | 0 | 5200 | 0 | 358.05 | 558.05 |
Row by row
5 January — sell the put. One contract at $1.50 per share is 1 × 1.50 × 100 = $150.00, less $0.65 in fees, so Option cash is $149.35. You hold no shares, so the break-even column stays empty: there is nothing yet to break even on.
16 January — the put is assigned. No premium changes hands; what changes is that 100 shares arrive at the strike. Stock cash is −100 × 50 = −$5,000.00. Shares held becomes 100. Net cash to date is 149.35 − 5,000 = −$4,850.65, and the break-even appears for the first time: 4,850.65 ÷ 100 = $48.5065 per share. You paid 50, but the put premium already means you are whole at 48.5065 rather than 50. Note what Premium to date does not do here — it stays at 149.35, because assignment is a stock event, not an option credit.
20 January — first covered call. $1.20 × 100 = $120.00 less $0.65 = $119.35. Premium to date rises to $268.70 and the break-even drops to 4,731.30 ÷ 100 = $47.313. This is the number to check before you choose a strike: at a break-even of 47.313, a 52 call that gets assigned produces a gain; a 46 call would not.
20 February — the call expires worthless. Nothing moves. The row still earns its place, because without it you cannot tell later whether the 20 January call expired, was bought back, or was simply never recorded. Premium to date and break-even are unchanged at $268.70 and $47.313.
23 February — second covered call. $0.90 × 100 = $90.00 less $0.65 = $89.35. Premium to date reaches $358.05 and break-even falls again to 4,641.95 ÷ 100 = $46.4195. Three option trades have now taken $3.58 per share off the effective cost of the stock.
20 March — the call is assigned and the shares are called away. Stock cash is −(−100) × 52 = +$5,200.00. Shares held returns to zero, so the break-even column goes blank again. Net cash to date is −4,641.95 + 5,200 = $558.05.
Reading the totals
Three totals describe the cycle:
- Total option premium: $358.05 — 149.35 + 119.35 + 89.35, net of the $1.95 of fees.
- Stock result: $200.00 — bought 100 shares at 50, sold at 52.
- Cycle result: $558.05 — the two added together, and the same figure the Net cash to date column arrives at on the last row.
Put that against the capital the cycle needed. A cash-secured put at the 50 strike ties up 50 × 100 = $5,000, so $558.05 is a return on that capital of 11.16%. The shares were held from 16 January to 20 March — 63 days. Both numbers are worth recording: a cycle result means nothing without the capital it used and the time it took.
Where manual tracking breaks down
The table above is six rows. One cycle. One account. Nothing went wrong. Real wheels are messier, and the failures are specific.
Rolls. If you had bought back the 20 January call for $0.40 and sold a March call for $1.10 on the same day, that is two rows, one negative and one positive, and both belong to the same cycle. Miss the buy-to-close row and your premium total is overstated for the rest of the cycle — and so is every break-even below it. Rolls on the put side are worse: the premium from the earlier puts still belongs to the cycle even though those contracts no longer exist.
Partial assignment and partial fills. Sell three puts, get assigned on two, and the share count no longer matches the contract count. Sell 300 shares' worth of covered calls against 200 assigned shares and 100 pre-existing shares, and you now have to decide which premium belongs to the cycle.
Pre-existing shares. If you already owned 100 XYZ before the put was assigned, a later covered call could be written against either block. Attributing it by hand is guesswork, and whichever way you guess, the cycle's break-even moves.
Endings that are not call-aways. Sometimes you simply sell the shares on the open market. The cycle still ends; it just ends without an assignment row, and spreadsheets maintained by habit tend to leave such cycles open forever.
Multiple accounts. The same symbol wheeled in two accounts produces two sets of rows that must not be mixed. A put assigned in one account is not covered by a call sold in another.
Corrections. Brokers restate, fees arrive late, and a position that was recorded as a short call turns out to be covered. Each correction means re-running every running total below the edited row.
Contract size. The ×100 in the Option cash formula is an assumption. Mini options represent 10 shares and futures options use a broker-supplied multiplier, so a hard-coded 100 quietly produces wrong premium figures.
Volume. One cycle is easy. Twenty cycles across eight symbols, each with rolls and expirations, is a data-entry job you will eventually skip, and a skipped row is an inaccurate break-even on a live position.
How MetisTrades does it
MetisTrades builds the same cycle from your imported transactions instead of from typed rows. Everything it shows is an estimate derived from that imported activity.
Wheel Cycles
Go to Analysis → Wheel Cycles (route /analysis/wheels). The page detects a sequence that begins with an assigned short put, continues when shares are acquired, and then follows covered calls written against those shares. The assigned put can be a cash-secured put, another short put, or the short-put leg inside a defined-risk position. A cycle is Active while shares remain, and Completed once they have been disposed of, whether by call assignment or a manual stock sale.
Anonymous visitors can use the Analysis area after uploading transaction data for the current browser session. The dedicated Wheel Cycles sub-tab needs an active subscription or lifetime access; signed-in users without one are returned to Account Settings. The sub-tab is hidden from public share links.
The list is where the example cycle would appear as a single row — symbol, put strike, assigned share count, assignment date, number of covered calls, days held, net P/L and return percentage — rather than as six broker lines.
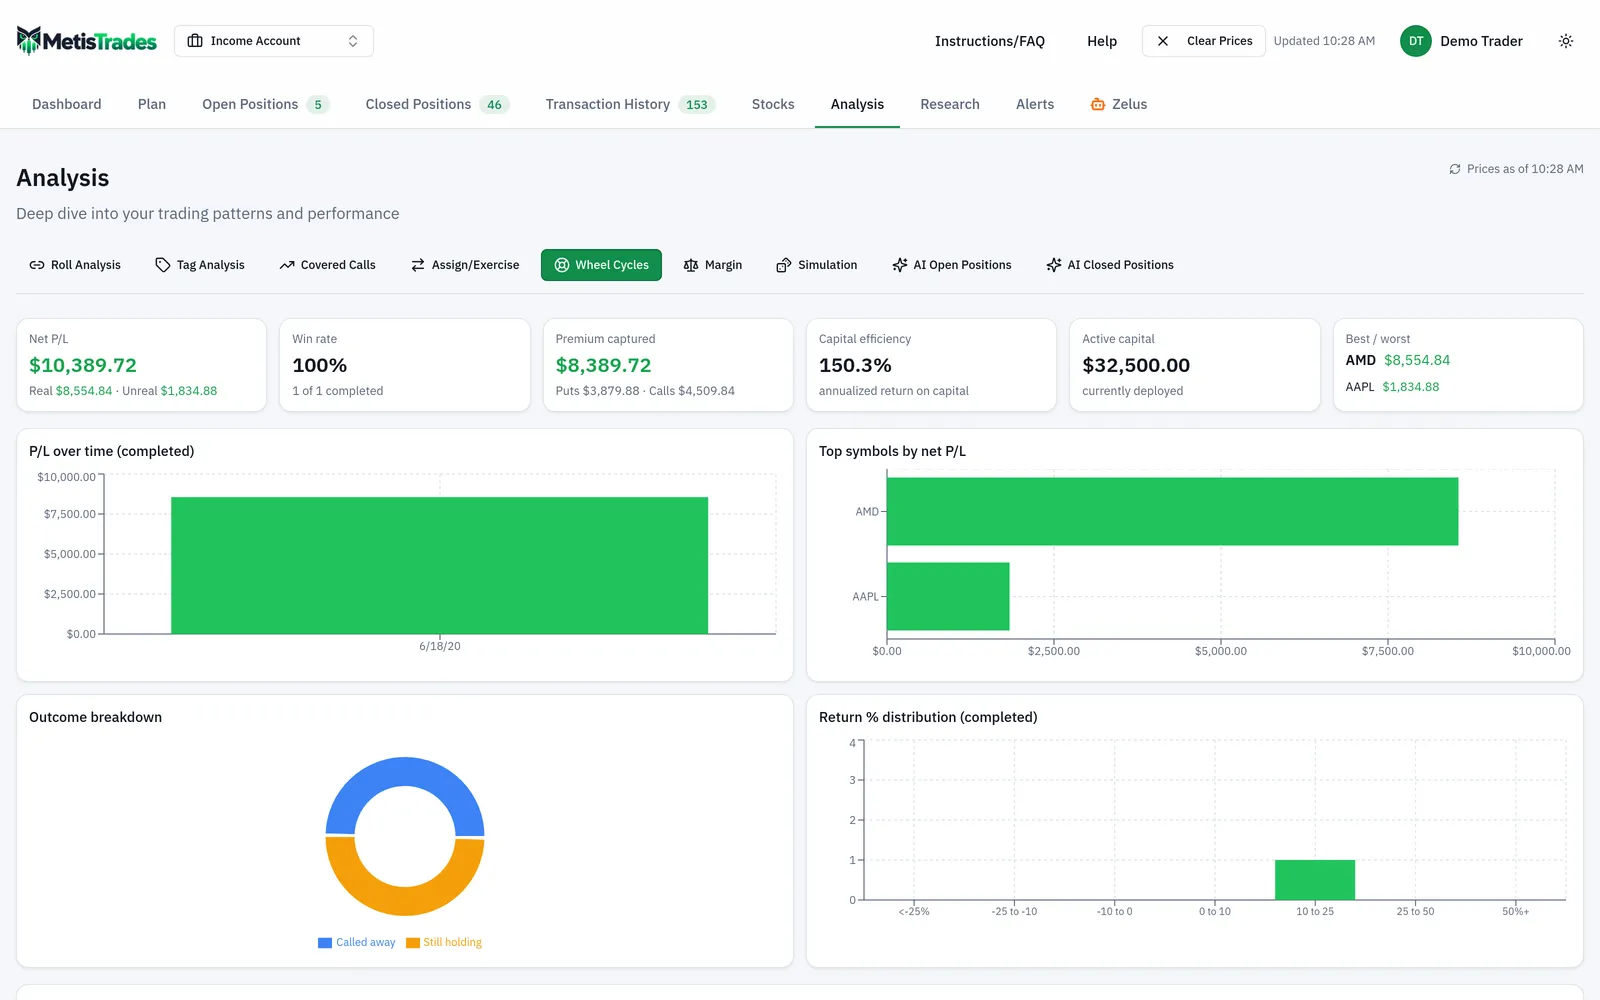
Above the list, summary tiles cover Net P/L (split into realized and unrealized), Win rate across completed cycles, Premium captured separated into put premium and call premium, Capital efficiency as annualized return on capital, Active capital currently deployed, and Best / worst symbols by combined net P/L. Charts show P/L over time for completed cycles, top symbols, an outcome breakdown of Called away, Sold back and Still holding, and a return-percentage distribution. Filters let you narrow by status, symbol, date range, outcome, cycle length (<30d, 30–90d, 90+d) and profitability, with Reset filters to start over.
Selecting a row opens Wheel Cycle — followed by the symbol. The Cycle Summary shows Net P/L, Return on capital, Put premium, Call premium, Stock P/L (assignment), Stock disposition P/L, Days held and Shares remaining. The Timeline runs through Cash-secured put opened, Put assigned · shares acquired, covered-call activity including roll-chain groupings, and finally Shares sold via call assignment or Shares sold (manual). Before the first call is written it says No covered call activity yet.
When the detector cannot safely connect a call — because pre-existing shares could have covered it, for instance — it leaves the call unattached rather than guessing. In an editable cycle you can select Attach, choose Covered call, and pick from same-symbol calls not already linked, or choose Cash-secured put to add another assigned put when several assignments fed the same wheel. Manually added items are marked Manually linked, and Detach removes an item. Detection and overrides stay inside the cycle's own trading account; All Accounts combines results for display only.
Assign/Exercise
Analysis → Assign/Exercise (/analysis/assignments) is the page for the assignment rows themselves — the ones that created your share basis. For a put-side event it records the strike as the acquired-share basis and tracks the option premium separately, then matches later stock sales to estimate disposition P/L.
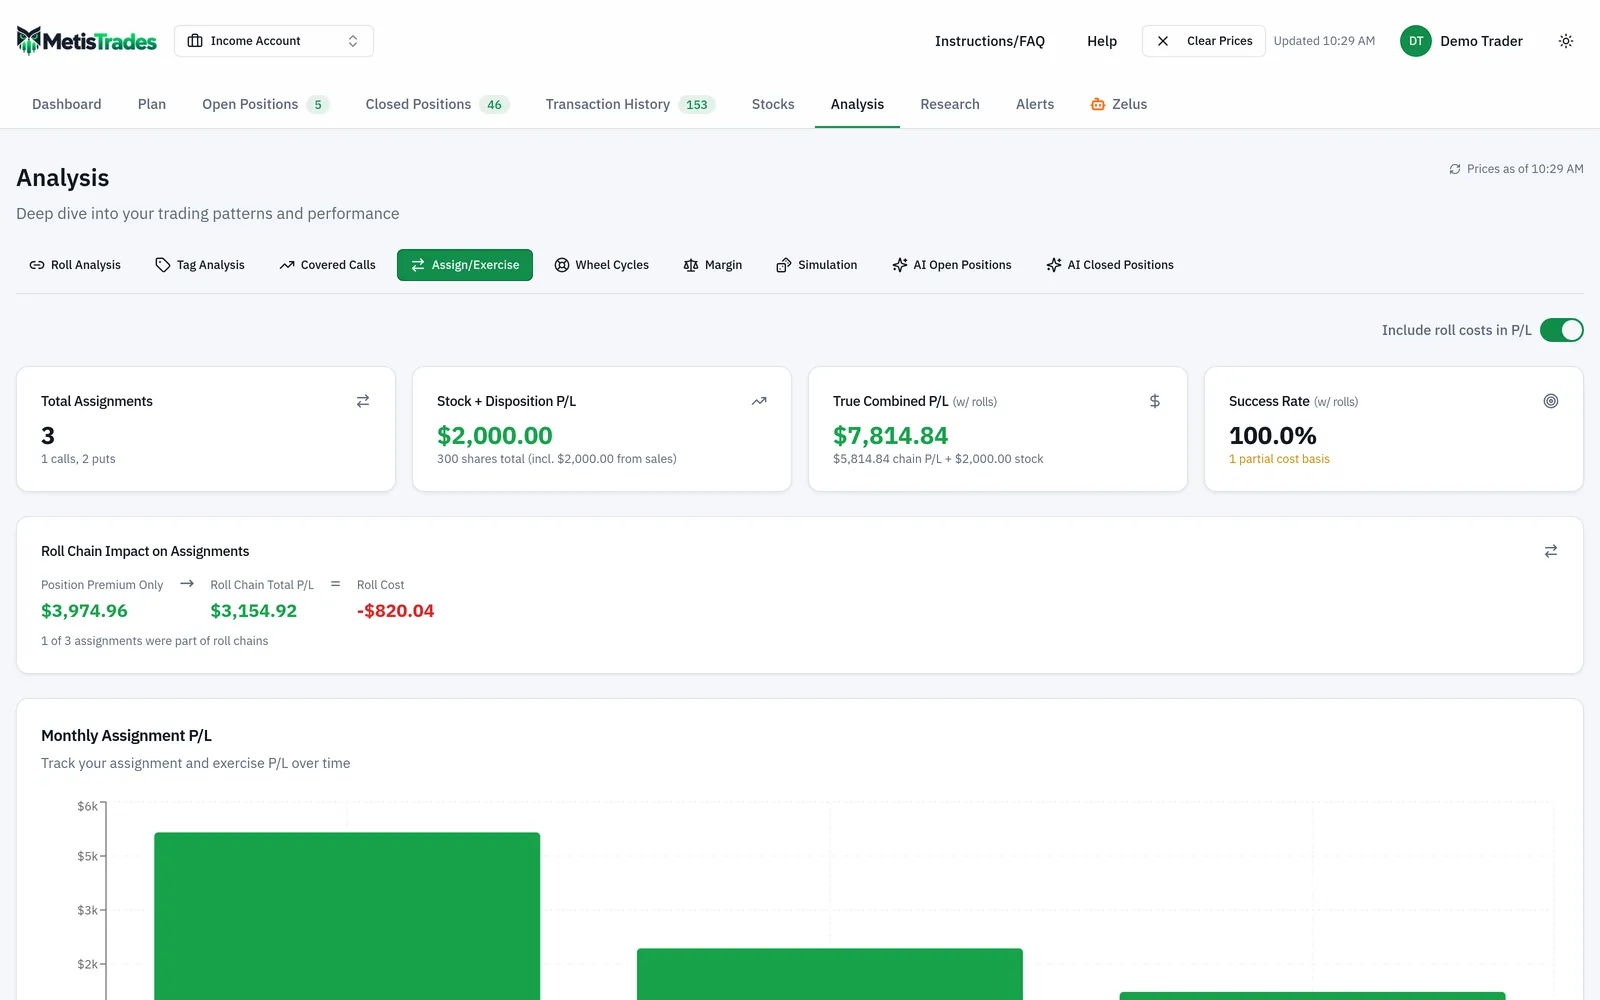
Summary cards show Total Assignments, Net Stock P/L (which becomes Stock + Disposition P/L when later sales exist), Combined P/L (True Combined P/L with dispositions) and Success Rate. An Include roll costs in P/L switch, on by default when any event belongs to a roll chain, substitutes the full roll-chain P/L for the final position's premium. Expanding a symbol opens its assignment history with Type, Strike, Cost Basis, Shares, Date, Premium, Stock P/L and the combined result; a Partial badge flags events where basis exists for only some shares. The page is available to pro users and admins, and to anyone holding a public share link for the shared data.
Covered Calls
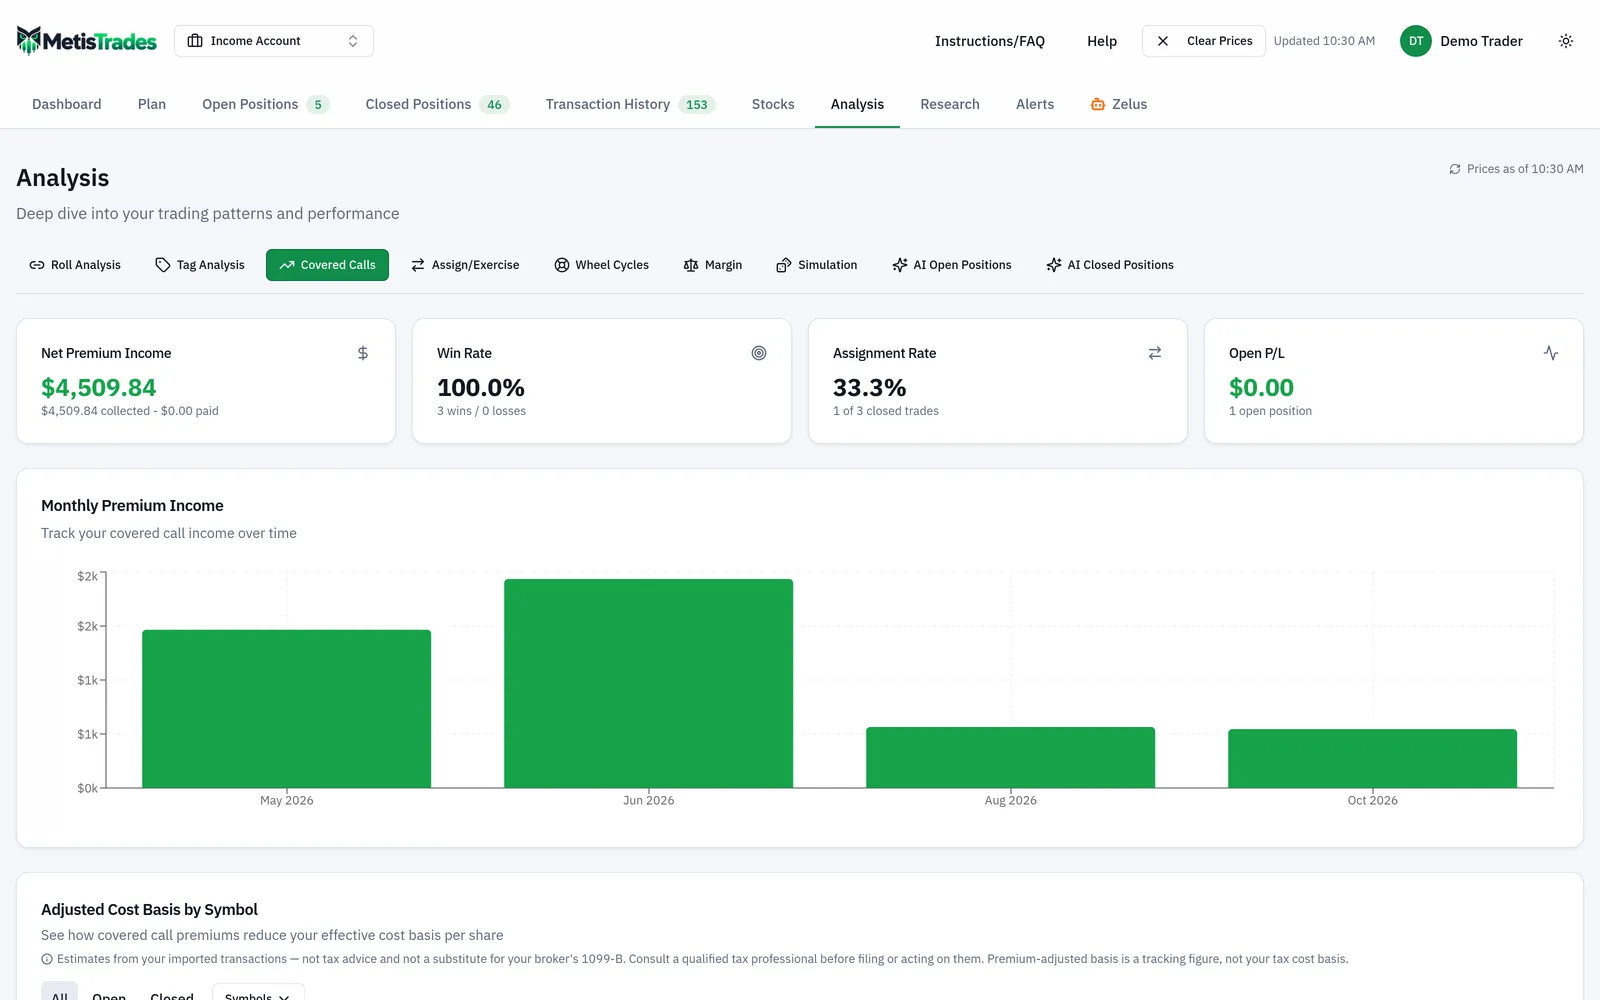
Analysis → Covered Calls (/analysis/covered-calls) covers the call side on its own terms: sell-to-open calls belonging to positions classified as Covered Call. Cards show Net Premium Income, Win Rate, Assignment Rate and Open P/L, with a Monthly Premium Income chart when the data spans more than one month. Trade history per symbol carries Strike, Opened, Expiration, Contracts, Premium, Net P/L and an Outcome badge of Open, Expired, Assigned, Closed or Rolled, and a wheel-cycle marker can open the related cycle detail panel.
How to read the results
In the Cycle Summary, Net P/L is Put premium + Call premium + Stock P/L (assignment) + Stock disposition P/L. For the worked example that is 149.35 + 208.70 + 200.00 = $558.05, the same figure the spreadsheet reaches. The split matters: it tells you how much of the result came from selling options and how much from the stock moving from 50 to 52. A cycle can show a healthy premium total and still lose money if the stock fell further than the premium covered.
Capital at risk is the assigned put strike times the assigned shares — $5,000 here — and Return on capital is Net P/L divided by that, 11.16%. Days held runs from the put assignment to the final disposition for a completed cycle (63 days), or to today for an active one, so it is shorter than the full span from the original put sale. Shares remaining is the number of assigned shares not yet matched to a recorded disposition; while it is above zero the cycle stays Active, which is why a partial call-away does not close a cycle.
Capital efficiency on the summary tiles is premium divided by average capital at risk, annualized using average days held. Annualizing a 63-day result assumes you can repeat it, which nothing guarantees. Treat it as a comparison between your own cycles, not a forecast.
Win rate is profitable completed cycles out of all completed cycles. Read it next to total P/L: a high win rate can coexist with a few deep losses on cycles where the stock kept falling. The Outcome breakdown of Called away, Sold back and Still holding is often more informative — a large Still holding slice means capital is parked, whatever the premium tiles say.
On the Covered Calls page, Adjusted Cost is Stock Cost minus Net Premium divided by Shares, and Reduction is the per-share difference in dollars and as a percentage of Stock Cost. This is the app's version of the break-even column in the spreadsheet.
Be clear about what Adjusted Cost is not. It is a premium-adjusted tracking figure, not your broker's tax cost basis. It spreads net covered-call premium across the currently recognized shares, so it can differ from broker accounting, and it is blank when there is no matching stock holding with shares and a cost basis.
Two more limits apply throughout. Quotes are delayed, so Open P/L on still-open calls uses the available mark, then the bid/ask midpoint, then the last price, and may be absent when no usable option price exists. And every premium, cost-basis, assignment and disposition figure is an estimate built from your imported transactions — useful for your own record keeping, not tax advice, and not a substitute for your broker's 1099-B.
Common mistakes
- Judging the put and the calls separately. An assigned put is not a loss and an assigned call is not a failure. Fix: record the cycle result — premium plus stock result — and compare it to capital at risk and days held.
- Letting the assignment row carry premium. Assignment moves shares at the strike; it collects nothing. Fix: leave Premium / share blank on assignment rows and let Stock cash do the work.
- Skipping expiration rows. An expired call that was never logged is indistinguishable from a call you forgot to record. Fix: write a zero-cash row for every expiry, as on 20 February.
- Dropping the buy-to-close side of a roll. Only the new credit gets recorded, so premium and break-even are both overstated. Fix: enter the close as a negative Premium / share, then the new sale as a separate row.
- Choosing a call strike below your break-even. At a break-even of $47.313, selling a 46 call locks in a loss if assigned. Fix: read the break-even column before picking the strike.
- Assuming every contract is 100 shares. Mini options and futures options use different multipliers. Fix: replace the 100 in the Option cash formula with the contract's actual multiplier.
- Merging accounts. A put assigned in one account cannot be covered by a call sold in another, and MetisTrades does not infer cross-account cycles. Fix: keep one log per trading account, and use the per-account grouping in All Accounts rather than reading a single blended total.
- Ignoring unattached covered calls. When pre-existing shares make the source ambiguous, the detector leaves the call out on purpose. Fix: open the cycle and use Attach → Covered call when you know the call belongs there.
Related guides and help pages
Related guides
- Your wheel is stuck: shares 30% under water — the honest ways out
- Plan, Track, Optimize: a complete tour of MetisTrades
- Assigned at $100 with the stock at $85: where do you sell the first call?
- Assignment and Exercise Explained: Shares, Cash and Basis
- Measuring wheel cycle returns: premium, stock result and days held
- PMCC Short Call Went ITM: Roll, Close Both, or Exercise the LEAPS?