Getting an AI Review of Your Open Positions
AI Open Positions writes a report on the risk and management of the option positions you still hold. Here is a worked XYZ portfolio, the steps to generate a report, and how to read and question what it says.

What it does and when to use it
AI Open Positions generates a written Portfolio Analysis Report about the option positions you currently hold. It is reached from Top nav → Analysis → AI Open Positions, at the route /analysis/ai.
The question it answers is narrow and useful: given what I am holding right now, what deserves attention and what are my management choices? The report focuses on immediate attention items, conditions to watch, position-level management, portfolio exposure, theta, and assignment risk. It is not a scorecard of past trades — closed-trade totals are included only as portfolio context, not as a closed-position review.
To build the report, the run uses position structure, dates, premiums, current P/L, available delayed pricing, Greeks, roll-chain context, and your stock holdings for share-coverage context. That last item matters: because the run receives your stock holdings, it can assess whether short calls appear covered and discuss what assignment would mean.
A few terms the report leans on, in plain words:
- Delta — the approximate dollar change in a position's value for a $1 move in the underlying. A delta of +50 behaves roughly like 50 shares.
- Theta — the approximate daily dollar change in value from time decay alone, all else equal. A short option position usually has positive theta.
- Assignment — when the option seller is required to fulfil the contract after the holder exercises. A short call assignment normally sells your shares at the strike; a short put assignment normally buys shares at the strike.
- Roll chain — the linked sequence of positions created by rolling the same strategy over time. Cumulative roll-chain P/L can differ from the current segment's P/L.
- DTE — days to expiration, the calendar days remaining before an option expires.
Access: the report requires a signed-in account, and because Analysis is part of the subscribed workspace, a Pro user can reach it. Signed-in users without an active subscription see the limited signed-in navigation instead. If you are in an anonymous session with uploaded data, this sub-tab shows Sign In Required with a Sign In button and a Start Free Trial link rather than generating a report. The sub-tab is hidden from public share links.
A worked scenario
You hold four open option positions, all on XYZ, which last traded at $57.40. You also own 100 shares of XYZ bought at $48.00.
| Position | Legs | DTE | Opened for | Current mark | Unrealized P/L |
|---|---|---|---|---|---|
| A — Covered Call | Long 100 shares @ $48.00, short 1 XYZ 55 Call | 5 | $1.20 credit | $2.65 | +$795 |
| B — Cash Secured Put | Short 1 XYZ 50 Put | 31 | $0.95 credit | $0.30 | +$65 |
| C — Put Credit Spread | Short 1 XYZ 52.5 Put, long 1 XYZ 47.5 Put | 17 | $1.10 net credit | $0.45 | +$65 |
| D — Short call | Short 1 XYZ 60 Call | 31 | $0.55 credit | $0.70 | −$15 |
The arithmetic behind position A, step by step. The shares are up $9.40 each: 100 × ($57.40 − $48.00) = +$940. The short 55 call was sold for $1.20, or $120 for one contract of 100 shares, and would now cost $2.65, or $265, to buy back: $120 − $265 = −$145. Net: $940 − $145 = +$795.
Position A is also the third segment of a roll chain. The two earlier call segments closed for a combined +$85, so cumulative roll-chain P/L is $85 − $145 = −$60 on the call side, with a roll count of 2. The current segment and the chain tell different stories, which is exactly why both are supplied to the run.
Positions B and C are short premium that has decayed in your favour. Position D is the awkward one: your only 100 shares already back position A's 55 call, so the short 60 call has no shares behind it.
Adding the four positions: $795 + $65 + $65 − $15 = +$910 unrealized. Summing the signed leg deltas gives +100 (shares) − 82 (short 55 call) + 12 (short 50 put) + 22 (put spread, +34 short leg and −12 long leg) − 18 (short 60 call) = +34. Summing leg thetas gives $4.10 + $1.90 + $2.40 + $1.60 = +$10.00 a day.
Step by step in MetisTrades
1. Open the page and set the account scope
Go to Top nav → Analysis → AI Open Positions. The route opens the AI Open Positions sub-tab directly. The latest saved analysis is loaded automatically for the selected account scope, so confirm you are in the scope you want — a single trading account or All Accounts — before you do anything else.
2. Read the header card before you generate
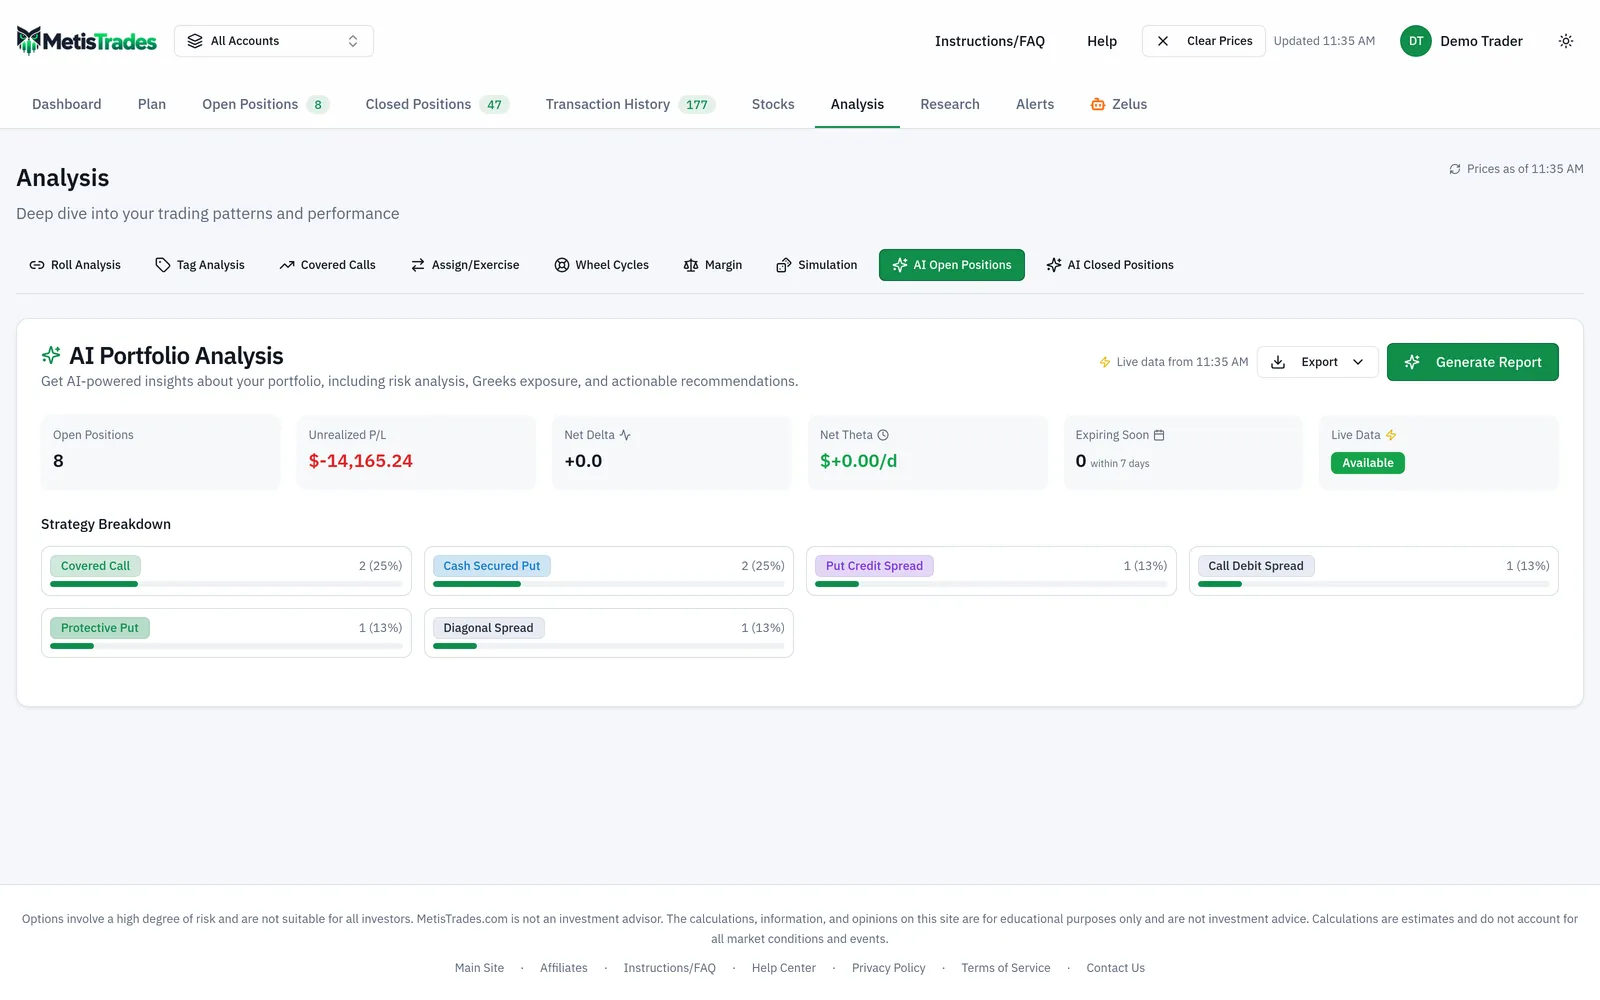
The AI Portfolio Analysis header card shows six current summaries: Open Positions, Unrealized P/L, Net Delta, Net Theta, Expiring Soon (positions with at least one leg expiring from today through 7 days away), and Live Data, shown as Available or Not Loaded. Despite that label, market quotes in MetisTrades are delayed; read Live Data as whether the latest available pricing has been loaded.
For the XYZ scenario the card reads: Open Positions 4, Unrealized P/L +$910, Net Delta +34, Net Theta +$10.00, Expiring Soon 1, Live Data Available. Below it, Strategy Breakdown shows the count and percentage of open positions by displayed strategy — here four strategies at 25% each, including any manual strategy reclassifications you have saved.
If pricing has not loaded, the page warns Live pricing data not loaded and explains that the report can still use available data. You can generate anyway, but Greeks and current market-derived details may be incomplete.
3. Generate the report
Select Generate Report when no saved report is present. Submitting first shows Submitting...; while the background job runs, the button shows Analyzing... with elapsed seconds, and a separate progress card says Analyzing Your Portfolio. The page checks for completion in the background and displays the result when it is ready. If the run fails, an error card appears with Try Again.
Once a report exists, the same control is labelled Regenerate Report.
The finished report appears under the same header card, so you can compare the prose against the six summaries and the Strategy Breakdown as you read. Look at the header row above the text: it shows when the report was generated, the model attribution when available, and the analyzed-position counts shown by the page.
4. Revisit, compare and manage history
Opening the page does not run the analysis again — the latest saved report is treated as cached content and is loaded as-is. Use History to choose a past report by date; the newest entry is marked Latest. An older entry opens in read-only mode showing Viewing report from, with a Back to latest button, and the page says Loading report... while it fetches. If the entry no longer exists you see Could not load this report. It may have been deleted. You cannot generate another report while viewing an older one.
The delete control beside a history entry opens Delete this report?, where Delete removes it permanently and Cancel keeps it. Clear all history opens Clear all history? and removes every AI portfolio analysis report in the current account scope.
5. Export the underlying position data
Export is available when open positions exist, in Markdown (.md), Spreadsheet (.csv), Plain Text (.txt) and Excel (.xlsx). The export contains structured position and leg information and is separate from the generated AI prose, so use it when you want the figures in your own sheet rather than a copy of the write-up.
How to read the results
Start with the six summaries, because the prose is written against them.
Unrealized P/L of +$910 is the estimated open-position P/L, using loaded delayed pricing when available and imported position P/L otherwise. It is what the four positions would be worth on paper at the loaded prices. It is not a settled result, and it is not what you would receive on a fill.
Net Delta +34 is aggregate share-equivalent directional exposure across open positions when Greeks can be calculated. In the scenario it is a useful corrective: it looks like a stock-heavy portfolio, but the short 55 call's −82 delta has offset most of the 100 long shares. A $1 rise in XYZ moves the book roughly $34, not $100.
Net Theta +$10.00 is aggregate estimated daily time-decay exposure when Greeks can be calculated. It tells you the book is short premium and currently positioned to benefit from the passage of time, all else equal. It is a snapshot estimate at one moment, and it changes as prices, volatility and dates change.
Expiring Soon: 1 points straight at position A, with 5 DTE and the 55 call $2.40 in the money. Expect the generated text to raise it under immediate attention and assignment risk: assignment would sell your shares at $55, producing 100 × ($55 − $48) = $700 on the shares plus the $120 credit, $820 in total, against the $795 the position currently shows — and giving up the $240 by which the shares sit above the strike.
Strategy Breakdown and the stock-holding context are what let the report separate position A from position D. Position A's call is backed by the 100 shares; position D's short 60 call is not, and the consequences of assignment on an uncovered short call differ.
Where a position belongs to a roll chain, the run receives cumulative roll-chain P/L, roll count, credits and debits. For position A, the current segment shows −$145 on the call while the chain shows −$60. Neither number is wrong; they answer different questions, so check which one a sentence in the report is describing.
What the report does not mean: it is informational, not financial advice, and it does not place, close, roll or adjust trades. A recommendation to "consider rolling" is a prompt to think, not an instruction, and nothing happens in your broker account as a result of generating it. The text is also a snapshot from its generation time — if the figures look stale, load current prices and regenerate.
Limits and assumptions
The report is generated text and can be incomplete, inconsistent or wrong. Read it as a prompt to check things yourself, and verify every figure it quotes against the position pages.
It reflects the account scope, imported positions, saved classifications and pricing available when you started the run. Change any of those — switch accounts, import missing transactions, save a strategy override, load prices — and the existing report will not update until you select Regenerate Report.
Quotes are delayed. Generated references to current values mean the latest available price, and the executable market is bounded by available bids and asks, so a fill can differ.
Greeks are estimates and may be absent when the required price or contract data is unavailable. If Live Data reads Not Loaded, the report can still use available data, but Net Delta, Net Theta and any per-leg Greek discussion may be thin or missing.
All P/L, premium and roll-chain figures derived from imported transactions are estimates. Missing opening trades, transfers, multipliers, assignments or fees change what the run sees. Any tax-related figure is an estimate from your imported transactions, not tax advice, and not a substitute for your broker's 1099-B.
Finally, the subject is open positions. Closed trades appear only as portfolio context, so do not use this report to judge how a finished strategy performed.
Common mistakes
- Treating the loaded report as fresh. The page loads the latest saved report and does not re-run on its own — select Regenerate Report when you want current data reflected.
- Generating with Live Data showing Not Loaded, then trusting the Greeks talk. Load the latest available pricing first, or read the exposure sections as provisional.
- Trying to generate while reading an older report. Select Back to latest first; generation is blocked in read-only history view.
- Leaving a shares-backed short call showing the wrong displayed strategy. Save the strategy reclassification before generating, since the displayed strategy override is included in the position data used for a new run.
- Generating in the wrong account scope. The saved report and history belong to the selected scope — choose the single account or All Accounts view you actually want reviewed, then generate.
- Confusing roll-chain P/L with the current position's P/L. In the XYZ example that is −$60 against −$145; check which figure a sentence refers to before acting on it.
- Using Clear all history as housekeeping. Deleting a report or clearing history is permanent, and Export saves position and leg data rather than the prose, so keep anything you want to reread.
Related guides and help pages
Related guides
- Plan, Track, Optimize: a complete tour of MetisTrades
- Analyzing closed-trade performance: win rate, expectancy and profit factor
- Reading your dashboard statistics: what each headline number actually measures
- Building a custom dashboard in MetisTrades
- Comparing Results by Tag: Which of Your Setups Actually Pays
- Simulating the range of results ahead from your own closed trades