Getting an AI review of your closed trades
How to filter your closed positions in MetisTrades, read the performance summary, and generate an AI Trade Coach report — plus how to question what the write-up tells you.

What it does and when to use it
AI Closed Positions answers one question: across the trades I have already finished, what patterns show up, and which of them are worth doing something about?
It combines two things on one page. The first is a closed-trade performance dashboard — counts, win rate, total profit and loss, average time in trade, best and worst trade, a breakdown by strategy and a month-by-month list. The second is an AI Trade Coach write-up: a generated report that reads your filtered closed positions and summary statistics and describes patterns, strengths, weaknesses and possible process improvements.
A few terms before we go further.
- Closed position — a position that is finished. It has an entry date and an exit date, and its profit or loss is no longer moving.
- P/L — profit or loss. Positive is a gain, negative is a loss.
- Realized P/L — profit or loss from activity that has been closed or settled, as opposed to the paper gain or loss on something still open.
- Win rate — the share of completed trades counted as wins. Read it next to total P/L, because a high win rate can sit alongside a few large losses.
- Strategy — the label MetisTrades gives a position, such as Cash Secured Put or Covered Call.
The tool is for review, not selection. It looks backwards at what you recorded. Use it when you have enough finished trades for patterns to mean something — after a quarter of activity, at the end of a year, or when you suspect one strategy or one symbol is quietly costing you money and you want the numbers in front of you before you decide anything.
The dashboard and the generated report require a signed-in account. Because Analysis is part of the subscribed workspace, a Pro user can reach it; signed-in users without an active subscription cannot reach Analysis and see the limited signed-in navigation instead. Anonymous visitors who have uploaded data see Sign In Required on this sub-tab, with a Sign In button and a Start Free Trial link. The sub-tab is hidden from public share links.
A worked scenario
Suppose you have 28 closed positions recorded, mostly premium selling on a handful of names, with XYZ as your largest. You want to review the most recent 20.
You set Positions (Most Recent) to 20, leave Outcome on All Trades and leave Symbols on All Symbols. The summary cards come back like this:
| Card | Value |
|---|---|
| Closed Trades | 20 (14 wins, 6 losses) |
| Win Rate | 70% — average winning P/L $290 |
| Total P/L | $520 — average losing P/L −$590 |
| Avg Days in Trade | 23 |
| Best Trade | +$612, XYZ, Cash Secured Put |
| Worst Trade | −$1,480, XYZ, Put Credit Spread |
Check the arithmetic yourself, because it is the whole story. Fourteen wins at an average of $290 is 14 × $290 = $4,060 of winning P/L. Six losses at an average of −$590 is 6 × −$590 = −$3,540. Net: $4,060 − $3,540 = $520. The win rate of 14 ÷ 20 = 0.70 is real, and it earned you $520 across twenty trades and roughly 23 days each.
Performance by Strategy charts wins and losses for up to eight strategy groups, ordered by trade count. Here it shows three:
| Strategy | Trades | Wins | Losses |
|---|---|---|---|
| Cash Secured Put | 9 | 8 | 1 |
| Covered Call | 7 | 5 | 2 |
| Put Credit Spread | 4 | 1 | 3 |
Nine plus seven plus four is 20, and 8 + 5 + 1 = 14 wins, so the groups account for every filtered trade. The put credit spreads are 4 of 20 trades but 3 of 6 losses.
To see what those losses cost, you change Outcome to Losses Only and leave the count at 20. The three put credit spread losses come back as −$1,480, −$620 and −$540, which is −$2,640. The other three losses total −$900. That is −$3,540 in all, matching the average of −$590 across six losses.
So three trades out of twenty produced −$2,640 of the −$3,540 in losses, about 75% of your loss dollars. Against a total P/L of $520, those three trades are the difference between a flat quarter and a clearly positive one. That is the pattern you want the AI Trade Coach to comment on — and the pattern you want to be able to check for yourself, so you can tell whether its comment is sound.
Step by step in MetisTrades
1. Open the page
Go to Top nav → Analysis → AI Closed Positions, or open the route /analysis/trade-review directly, which opens the AI Closed Positions sub-tab. While statistics load, the page says Loading trade review data.... If you have no closed positions at all, it shows No Closed Positions.
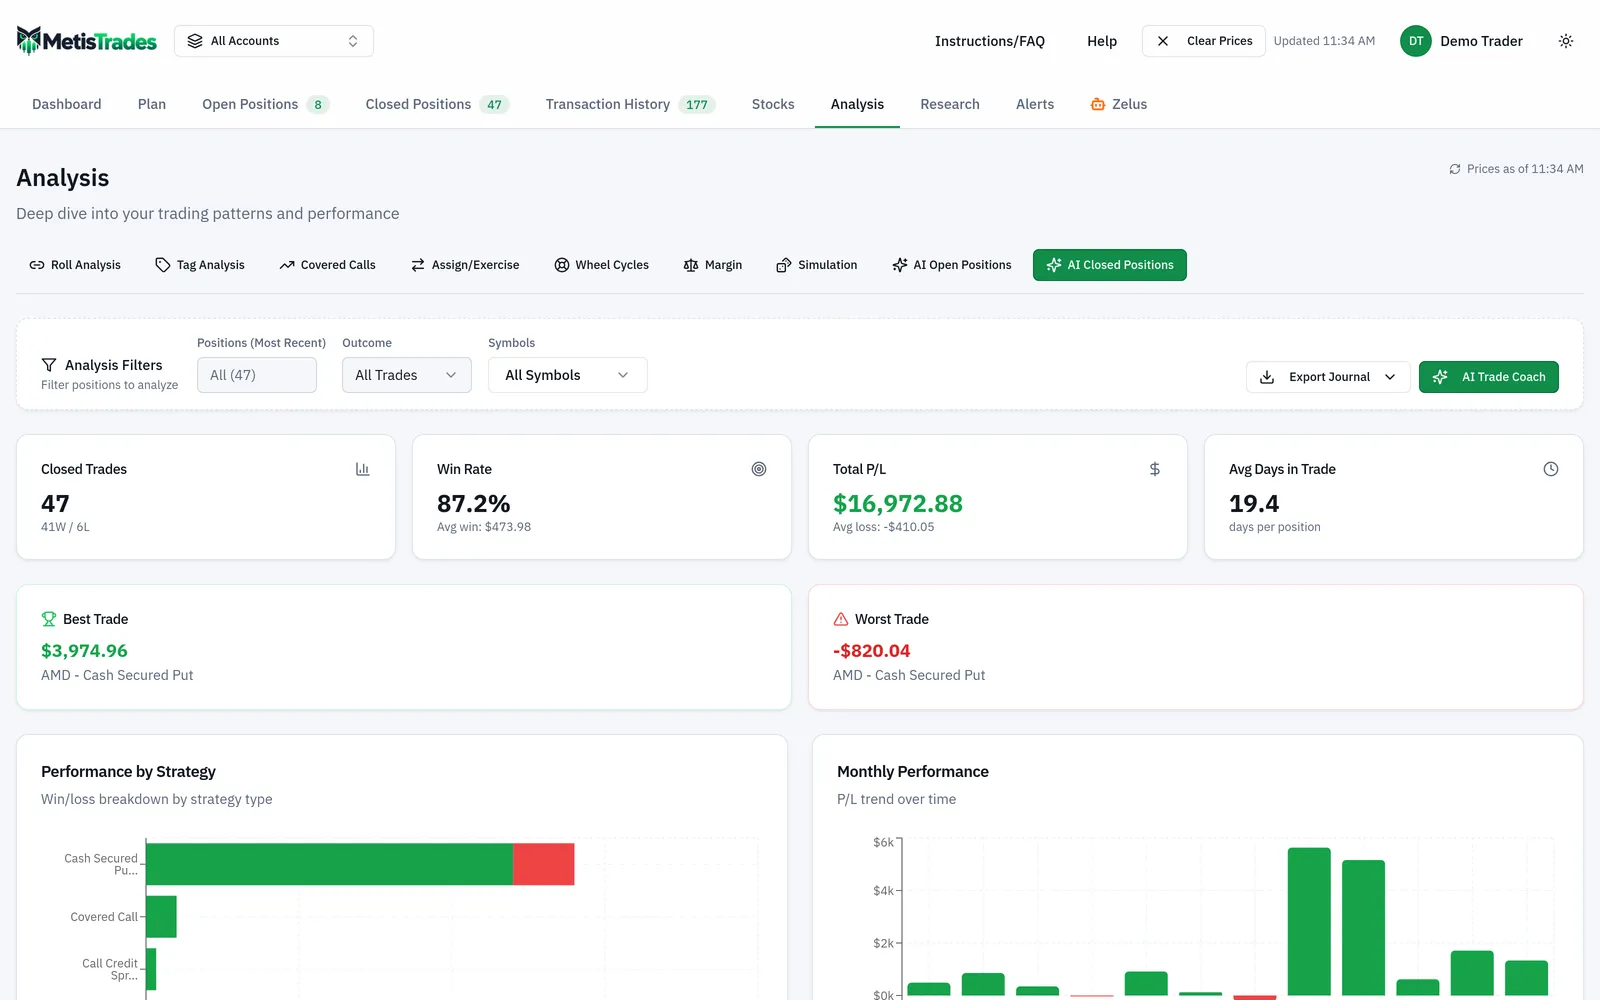
The filter card is titled Analysis Filters with the description Filter positions to analyze, and the performance summary and charts show the trades that survive those filters. Look at the active-filter badge and the Closed Trades count together — they tell you which slice of your history you are actually looking at.
2. Set the filters before anything else
The same filters drive the displayed statistics, the AI review and the trade-journal export, so set them first.
- Positions (Most Recent) accepts a positive whole number. In the scenario you enter 20. This is a limit applied after ordering closed positions by exit date, newest first, so it gives you your last 20 completed trades. Leaving the field blank means all closed positions. Invalid, zero or negative counts are normalized back to blank when you leave the field, and the count cannot exceed the number of closed positions, which is shown as the input maximum.
- Outcome offers All Trades, Wins Only and Losses Only. Start on All Trades for the headline picture.
- Symbols starts at All Symbols and supports selecting multiple symbols. To look only at XYZ, pick it here. Clear selection removes symbol choices.
- An active-filter badge summarizes your choices, such as the last position count, Wins or Losses, and the number of symbols. Clear resets all active filters.
If your filters remove every match, the page shows No positions match your filters and offers Clear Filters.
3. Read the dashboard before you run anything
Work through the summary cards and do the multiplication, the way we did above. Monthly Performance shows the last 12 monthly P/L entries available to the dashboard, which is where a bad stretch stands out from a bad trade. Form your own view of the story first; it is much easier to judge a generated report when you already know what the numbers say.
4. Start the AI review
Apply the filters you want first, then select AI Trade Coach to start a background review of the matching closed positions and summary statistics. While submission or generation is active, the button says Analyzing..., and the result card shows Analyzing your trades... until text is ready. If the run fails, the page reports AI Review Failed.
The review receives the matching closed positions plus total realized P/L, closed-position count, win rate, wins and losses, average win and average loss, largest win and largest loss, average days in trade, performance by strategy, monthly performance, and each matching position's symbol, strategy, P/L, entry date, exit date and option-leg details.
5. Reopen, compare or remove past reports
When complete, the AI Trade Coach card shows the generated date and model attribution when available, rendered as formatted text with headings and lists. The latest saved Trade Coach report is loaded automatically for the selected account scope, and revisiting the page does not itself start a new run. Starting a new run replaces the currently displayed result with the new job and then saves the completed report.
Use History to open a past report by generated date. The newest entry is marked Latest; an older one displays Viewing report from and (read-only). While an old report loads, the page says Loading report..., and if it is unavailable the page says Could not load this report. It may have been deleted. Select Back to latest to leave history mode. The AI Trade Coach button is disabled while you are viewing a historical report.
Deleting one entry opens Delete this report?, which warns that deleting the Trade Coach analysis report cannot be undone; use Delete to confirm or Cancel to keep it. Clear all history opens Clear all history? for every Trade Coach report in the current account scope.
6. Export the underlying trades
Export Journal uses the active position-count, outcome and symbol filters and offers Markdown (.md), Spreadsheet (.csv), Plain Text (.txt) and Excel (.xlsx). The journal includes closed-position data and performance summaries; it is separate from the generated AI coaching prose. If you want to re-sort the same twenty trades by strategy or by loss size and check a claim in the report, this is the way.
How to read the results
Each card answers a narrow question, so hold it to that question.
- Closed Trades: 20 (14 wins, 6 losses). The number of closed positions matching the active filters — not your total trading history, and not anything still open.
- Win Rate: 70%, average winning P/L $290. Winning matching positions divided by all matching closed positions. It says nothing about size. Seventy percent with an average loss twice the average win is a very different business from seventy percent with symmetrical outcomes.
- Total P/L: $520, average losing P/L −$590. Combined realized P/L for the matching closed positions. It is not a return: the page does not tell you how much capital those twenty trades tied up, so $520 could be a thin result on a large base or a decent one on a small base. You have to supply that context.
- Avg Days in Trade: 23. Average elapsed time between entry and exit for matching positions. Useful for comparing $520 against the time and attention it took, but it is an average, so one 90-day position can pull it up.
- Best Trade and Worst Trade. The matching positions with the highest and lowest P/L, with symbol and strategy. Here the worst, −$1,480 on an XYZ Put Credit Spread, is larger in size than the best five wins combined would be at $290 each.
- Performance by Strategy. Wins and losses for up to eight strategy groups, ordered by trade count. It counts trades; it does not weight them by dollars. Put Credit Spread shows 1 win and 3 losses, and only when you filtered to Losses Only did you learn those three losses were −$2,640 of the −$3,540 total.
- Monthly Performance. The last 12 monthly P/L entries available to the dashboard. It shows when the damage happened, not why.
Now the written report. It is intended to identify patterns, strengths, weaknesses and possible process improvements in your closed trading history, and it has seen exactly the inputs listed earlier — including each position's symbol, strategy, P/L, entry and exit dates and option-leg details. That is a lot, but it is still only what you recorded.
Read it with the dashboard open and test each claim. If the report says your spread trades are dragging on an otherwise profitable put-selling approach, you can confirm that from four trades, three losses and −$2,640. If it says something about market conditions, sizing discipline or your reasons for entering, ask where in those inputs that could possibly have come from — the report does not know your account size, your intent at entry or anything you did not record. AI coaching is generated text and may misread patterns or suggest actions that do not fit your circumstances. Treat the output as informational, not financial advice, and treat a four-trade sample as four trades, not a verdict on a strategy.
Limits and assumptions
The page reviews recorded closed positions. It does not change transactions and it does not place trades.
Performance metrics derived from imported transactions are estimates. Any tax-related figures are estimates from your imported transactions, not tax advice, and not a substitute for your broker's 1099-B.
Results reflect the account scope and the filters that were in effect when the run began. A report generated with Positions (Most Recent) set to 20 and XYZ selected is a report about those trades only, even though the saved text sits in the same history list as a report about everything.
Saved reports are snapshots. Later imports, regrouping, notes or corrections do not update an old saved report — if your data has changed, start a new review rather than rereading the old one.
If any current market references appear in the generated prose, remember that quotes in MetisTrades are delayed and should be checked against the latest available price.
Finally, deletion is one-way. Deleting one report or clearing all history is permanent.
Common mistakes
- Running the review before setting the filters. The filters you have active when you select AI Trade Coach are the ones sent. Set Positions (Most Recent), Outcome and Symbols first, then start the run.
- Forgetting a filter is still on. A report run with Wins Only will describe a flawless trader. Check the active-filter badge and the Closed Trades count before you believe a headline, and use Clear to reset.
- Reading win rate as the result. Seventy percent produced $520 here because the average loss of −$590 was roughly double the average win of $290. Always read Win Rate and Total P/L together.
- Treating Performance by Strategy as a dollar ranking. It charts wins and losses by count, ordered by trade count. Switch Outcome to Losses Only, or use Export Journal, to see which strategy actually cost the most.
- Drawing conclusions from a four-trade group. Three losses out of four is a reason to look harder at those trades, not proof the strategy is broken. Widen the position count before you change how you trade.
- Assuming the saved report refreshes itself. Revisiting the page loads the latest saved result; it does not regenerate. After new imports or corrections, start a new review.
- Clearing history to tidy up. Clear all history? removes every Trade Coach report in the current account scope and cannot be undone. Delete single entries you are sure about instead.
Related guides and help pages
Related guides
- Plan, Track, Optimize: a complete tour of MetisTrades
- Analyzing closed-trade performance: win rate, expectancy and profit factor
- Reading your dashboard statistics: what each headline number actually measures
- Building a custom dashboard in MetisTrades
- Comparing Results by Tag: Which of Your Setups Actually Pays
- Simulating the range of results ahead from your own closed trades