Screening a Watchlist with the Options Analyzer
The Options Analyzer ranks a curated watchlist by end-of-day options statistics and momentum, then shortlists individual contracts. Here is how to run a screen on one symbol, read every column, and question what the scores are telling you.
What it does and when to use it
The Options Analyzer answers two questions in one place: which symbols on this watchlist have options worth a closer look right now, and which individual contracts rank highest for the job I have in mind.
It is an end-of-day screening board for symbols on a curated watchlist. You compare symbols in the Symbol screener view, sort the board by any statistic with a sort control, smooth the momentum reading over several trading days, and open an unlocked row for a deeper review. The second view, Shortlist, ranks individual contracts across the whole watchlist for either directional buying or premium selling.
It is useful when you have a job in mind but no symbol yet: you want to sell premium somewhere this week, or you want a call to express a bullish idea, and you would rather start from a shortlist than scroll chains one ticker at a time. It is not useful for watching a position during the session, because the data is a stored end-of-day snapshot.
A few terms the board relies on, in plain words:
- Implied volatility (IV) — the level of future movement implied by an option's market price under a pricing model. It is not a direction forecast; high IV means a wider range of moves is being priced in. ATM IV is the at-the-money reading for the roughly 30-day expiration.
- IV Rank — where today's ATM IV sits inside its trailing 52-week range, 0 at the bottom and 100 at the top.
- Realized volatility — how much the stock actually moved, measured here over 20 days. VRP (volatility risk premium) is ATM IV minus that figure, in volatility points.
- Open interest (OI) — the number of contracts currently open at a strike and expiration, as opposed to volume, which counts today's trades.
- Delta — roughly how much an option's value changes for a $1 move in the underlying; a −0.22 put behaves roughly like being short 22 shares.
- Midpoint — the price halfway between bid and ask. It is a reference value, not an executable quote.
- Days to expiry (DTE) — calendar days left before the contract expires.
A worked scenario
You want to sell a put for premium on something in the next month, and you have no particular symbol in mind. You open the board after the close, set Mode to Standard, and set Momentum avg to 7d so a single noisy day does not decide the order. XYZ comes up near the top of the screen.
| Column | XYZ | What produced it |
|---|---|---|
| Price | 48.20 | Latest underlying close |
| 5d % | +3.1% | 48.20 against 46.75 five sessions ago: 1.45 ÷ 46.75 = 3.1% |
| ATM IV | 42.5% | At-the-money IV for the ~30-day expiration |
| IV Rank | 68 | Today's ATM IV sits 68% of the way up its 52-week range |
| IVR − VIXR | +22 | 68 minus a VIX 52-week rank of 46 |
| VRP | +9.4 | 42.5 ATM IV minus 33.1 20-day realized volatility |
| 1w IV Δ | +4.2 | 42.5 today against 38.3 five sessions ago |
| P/C Vol | 0.62 | 18,600 put contracts ÷ 30,000 call contracts |
| P/C OI | 0.88 | 44,000 put OI ÷ 50,000 call OI |
| Unusual Vol | flagged | 48,600 total option volume against a 20-day average of 21,000 — 2.3×, past the 2× threshold |
| Momentum | +34 | Standard-mode composite, 7-day average, on a −100 to +100 scale |
| Setup | −12, Bull tag | Current positioning level is mildly negative; the tag says positioning recently moved bullishly against price |
| Trend | up / up / flat | Short-, medium- and long-horizon momentum direction |
| Last flip | 11 days ago | Most recent smoothed momentum inflection |
| Last Updated | yesterday's market date | Date of the most recent end-of-day snapshot |
You then switch to Shortlist, leave the intent on Income, and find an XYZ contract in the ranked list: a 45 put, 31 days to expiry, Income score 78, delta −0.22, midpoint 1.05, spot 48.20, with ranking reasons citing IV rank, conservative delta and liquidity.
The board does not show a yield column, but you can work that out with a calculator in ten seconds. One contract at a 1.05 midpoint is 1.05 × 100 = $105 of premium. Securing the put with cash takes 45 × 100 = $4,500. That is 105 ÷ 4,500 = 2.33% over 31 days, or 2.33% × 365 ÷ 31 ≈ 27.5% if you annualise it. That arithmetic is a description of the premium on offer at a reference midpoint, not an expected return: if XYZ falls below 45 you can be assigned the shares, and your fill may not be 1.05.
Step by step in MetisTrades
1. Open the board
Go to Top nav → Research → Options Analyzer. The board opens on the Symbol screener view with one row for each enabled watchlist symbol, sorted by Momentum, descending. If the board cannot load you will see Couldn't load the screener. and a Retry button.
2. Check the snapshot date before anything else
Look at the Last Updated column. It shows the market date of the most recent end-of-day snapshot, not the moment you opened the page. A symbol still waiting for its first snapshot shows queued there. If the date is older than you expected, read everything on the row as being that old.
3. Set Mode and Momentum avg
The Mode control offers Standard, Balanced and Aggressive — three weighting modes applied to the same underlying momentum evidence. The Momentum avg control offers As of (the latest snapshot, and the default), 3d, 7d and 14d. Choosing a trailing average automatically sorts the board by Momentum in descending order; if an average is unavailable for a row, that row falls back to its as-of score. In the scenario you chose 7d, which is why the order changed when you clicked it.
4. Sort by the statistic that matches your job
Every column with a sort control sorts in either direction, and missing values stay at the bottom. Selecting Symbol for the first time sorts ascending; selecting any other column for the first time sorts descending. For a premium-selling screen, sorting by IV Rank or VRP gets you to the richer-looking options faster than momentum does.
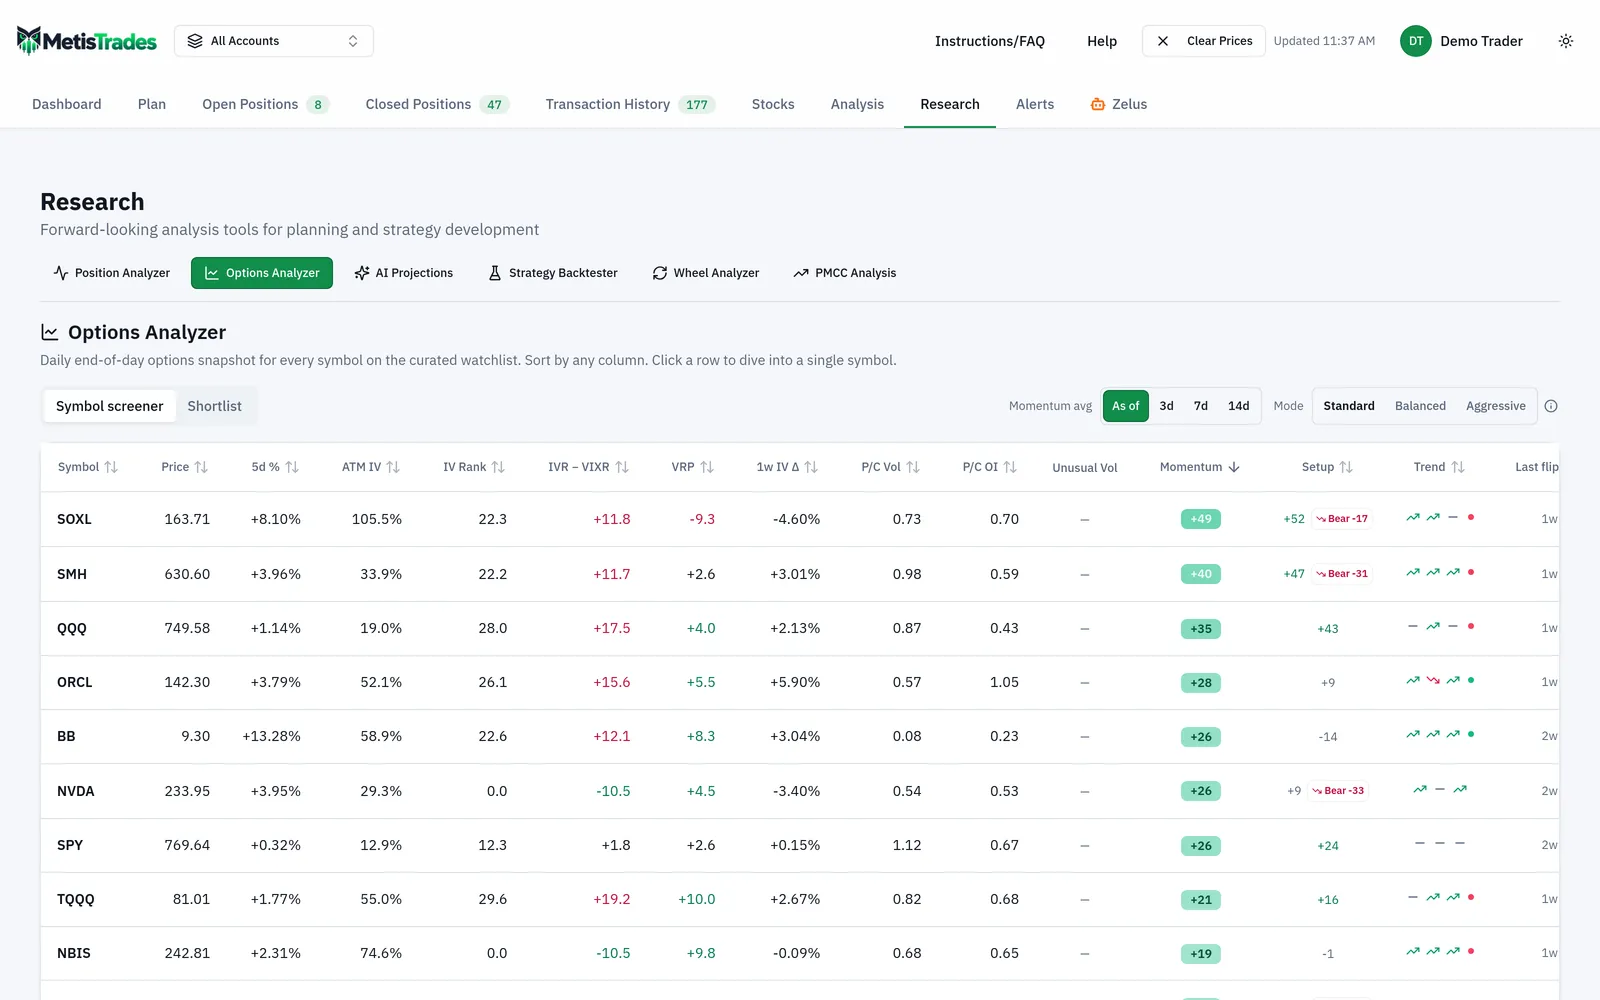
This is the whole board: the controls across the top, then the screener rows with their statistics, momentum, setup and trend reads. Compare the IV Rank, VRP and Last Updated columns across a few rows before you pick one to open.
5. Open an unlocked row for the deep dive
Selecting an unlocked row in Symbol screener opens that symbol's Options Analyzer symbol deep dive. Free-tier watchlist symbols are readable by everyone, including anonymous visitors. Paid-tier symbols stay visible as locked rows for anyone without Pro — the row is a preview, with its statistics and deep-dive link locked. When paid symbols are present, the page says how many are Pro-only and shows Start free trial to an anonymous visitor or Upgrade to a signed-in viewer.
6. Switch to the Shortlist
Change the view to Shortlist. The card is titled Contract leaderboard and has two intent filters: Income, for contracts to sell for premium, and Directional, for calls to buy on a bullish idea and puts to buy on a bearish one. Income is the default, and the chosen intent is placed in the page address so a direct link keeps it.
Income returns a single ranked list of up to 50 contracts. Directional splits results into Bullish — buy calls and Bearish — buy puts, requesting up to 15 contracts on each side for up to 30 in total. You can sort by Directional score, Income score, Days to expiry, Strike or Type (call/put), and reverse the direction.
7. Read a contract row and follow it through
Each unlocked contract row shows its side, strike, expiration, days to expiry, score, delta, midpoint, spot price, plain-English trade guidance, and up to three ranking reasons. Selecting a contract opens its symbol deep dive and contract history; the row also offers chart and position-analysis actions. For non-Pro viewers, unlocked free-tier contracts stay represented while paid-tier entries appear as Pro-only contract details rows, sorted below the unlocked ones. If nothing clears the liquidity checks, the card says No contracts cleared the liquidity floors for this filter yet.
Your selected view, sort, direction, momentum average and shortlist intent are remembered for the current browser tab.
How to read the results
IV Rank 68 says XYZ's ATM IV is 68% of the way up its own 52-week range. It says nothing about whether 42.5% IV is high for any other symbol, and nothing about direction.
IVR − VIXR of +22 compares that 68 with the VIX's own 52-week rank of 46. Positive means XYZ's IV rank is richer than broad-market volatility rank; negative would mean cheaper on that comparison. It is a relative reading between two ranks, not a statement that XYZ options are mispriced.
VRP of +9.4 means options are implying about 9.4 volatility points more movement than XYZ actually delivered over the trailing 20 days. Positive VRP is what premium sellers generally look for, but realized volatility is backward-looking: a pending event can make today's wider implied range entirely reasonable.
P/C Vol 0.62 and P/C OI 0.88 say the day's flow leaned toward calls while the standing open interest is closer to balanced. Neither ratio tells you whether those contracts were bought or sold, or opened or closed.
Unusual Vol is a whole-symbol flag that fires when option volume is at least twice its 20-day average — here 2.3×. It is coarse by design: it does not establish buying, selling, opening, closing or a directional opinion. Use the symbol deep dive for contract-level volume and open-interest detail and peer percentiles.
Momentum +34 is the active mode's composite on a −100 to +100 scale, built from nine options and underlying signals, with any input that has no usable reading left out and the remaining inputs reweighted. Positive is more bullish, negative more bearish. It summarizes current and recent positioning and related history; it is not a price forecast.
Setup −12 with a Bull tag looks contradictory and is not. The number is the current positioning level, built from leading inputs such as skew velocity, IV compression, open-interest shifts and call-flow tilt. The tag is an early, unconfirmed divergence: over roughly ten sessions, the setup score moved against the price trend. Level and change can point in different directions.
Trend gives three arrows for short-, medium- and long-horizon momentum direction, with a dot marking a recent inflection. Last flip is the date of the latest zero-line cross or fast/slow average crossover in smoothed momentum — in the scenario, 11 days ago, so the current reading is not brand new.
On the shortlist, an Income score of 78 is a 0-to-100 score that emphasizes IV rank, conservative delta, annualized yield and liquidity. A Directional score is a 0-to-100 score for alignment with underlying trend, unusual flow, fresh positioning and a sensible delta. Both are descriptive scoring systems: they rank contracts against each other under those criteria, and a higher score is not a recommendation or a statement about how the trade will turn out. The midpoint of 1.05 is an end-of-day option midpoint, a reference value rather than an executable quote.
Finally, a dash in a cell means the metric did not have enough history or a usable input for that snapshot. Missing values are not replaced with guesses.
Limits and assumptions
The board uses end-of-day data and is never an intraday monitor. Displayed prices are latest stored closes or end-of-day option midpoints, not executable quotes — verify current market prices before making a decision.
The end-of-day snapshot sweep is scheduled for 5:00 p.m. Eastern, Monday through Friday, skipping market holidays and weekends. Administrators or cost controls can pause the schedule, and a completed snapshot can arrive after its scheduled start time. Read the displayed Last Updated value rather than assuming today's data has landed.
The watchlist is curated by administrators. You cannot add a ticker from this page, so the absence of a symbol says nothing about the symbol. The whole feature is controlled by a site-wide Options Analyzer flag; when that flag is off, the surface is hidden from non-admins.
The shortlist applies liquidity floors before ranking. A contract you expected to see may simply have failed those checks — that is not a negative judgment from the app. If nothing clears the floors for the current filter, the card says so rather than padding the list.
The momentum composite reweights itself around missing inputs, so two rows can be built from different numbers of active signals. Thin or new histories can fall back to Standard mode even when you selected Balanced or Aggressive. A trailing average also falls back to the as-of score when the average is unavailable.
No score, setup tag, trend arrow, contract ranking or volatility statistic is investment advice, a prediction or a trading signal. Selling puts and buying options both carry real risk of loss, and nothing on the board changes that.
Common mistakes
- Treating the board as a live view. It is an end-of-day snapshot — check Last Updated and re-check the market before placing anything.
- Trading from the midpoint. The 1.05 on the XYZ put row is an end-of-day reference midpoint, not a fill; price the contract at your broker before deciding.
- Reading Momentum as a price forecast. It describes options positioning and recent history; pair it with your own view and risk limits rather than treating +34 as a direction call.
- Assuming the Setup number and its tag must agree. The number is the current level and the tag is a roughly ten-session divergence; read them as two separate facts.
- Chasing the Unusual Vol flag. It only says volume was at least twice its 20-day average; open the symbol deep dive for contract-level detail before drawing conclusions.
- Picking a high Income score without checking the strike. Score 78 on a 45 put still means owning XYZ at 45 if you are assigned — size the trade to the collateral, not to the score.
- Thinking an empty shortlist means nothing is tradable. It usually means no contracts cleared the liquidity floors for that filter; change the intent or look at the screener instead.
Related guides and help pages
Related guides
- Implied Volatility: What Option Prices Say About Movement
- Plan, Track, Optimize: a complete tour of MetisTrades
- Building and Stress-Testing a Trade in the Position Analyzer
- Reading one symbol in depth: the Options Analyzer deep dive
- Backtesting an Options Strategy with the Strategy Backtester
- Replaying one options trade with Trade Backtest