Backtesting an Options Strategy with the Strategy Backtester
How to configure a strategy, run it over a historical window, and read the saved results honestly — including win rate, drawdown, skipped days and the limits of a daily-close simulation.
What it does and when to use it
The Strategy Backtester simulates one options strategy over a historical date window and reports what that set of rules would have produced across the period tested. You pick the symbol, the legs, how often the simulation opens a position, how it sizes and fills, which entry filters apply and when it closes. Then you run it, or add it to a queue, and review the saved run later.
A backtest is a simulation that applies a strategy and its rules to historical data. It describes the assumptions you fed in and the period you chose. It does not describe a future trade.
Some terms the tool leans on, in plain words:
- Leg — one option part of a position. A short put is one leg; a put credit spread is two.
- DTE — days to expiration, the calendar days left on a contract. The backtester uses DTE both to pick contracts and, optionally, to trigger an exit.
- Delta — roughly how much an option's value moves for a $1 move in the underlying. Here it is used as a strike selector: "find me the put near 0.20 delta".
- Entry cadence — the schedule that decides when the simulation attempts a new position: every trading day, specific weekdays, an exact DTE match, or once a month.
- Fill Price — the assumed fill convention for each option: Midpoint, Bid/Ask, or Bid/Ask + Slip.
Use it when you have a repeatable rule you can write down — "sell a 30-day put near 0.20 delta once a month, take profit at 50%, close at 7 DTE" — and you want to see how that rule behaved across a stretch of history, including the bad months. It is less useful for one-off discretionary trades, because there is no rule to simulate.
The Strategy Backtester is pro-flagged: you need an active subscription or lifetime access, plus the site's Research feature flag. Anonymous visitors reach the page but see Sign In Required, with a Sign In button and a Start Free Trial link, instead of the controls. The page itself is marked Beta Feature, which is a good reason to read its warnings before trusting a number.
A worked scenario
You have been selling monthly cash-secured puts on XYZ by feel and want to see whether a fixed rule would have held up through a full calendar year. A cash-secured put is a short put backed by enough cash to buy the shares if you are assigned.
The rule you want to test: once a month, sell one XYZ put near 0.20 delta with about 30 days to expiration; close it if the premium decays to half, otherwise close it at 7 DTE; never hold more than two at once.
| Setting | Value |
|---|---|
| Symbol | XYZ |
| Start Date / End Date | January 1, 2024 – December 31, 2024 |
| Starting Capital | 50000 |
| Fill Price | Bid/Ask + Slip |
| Comm. $/leg | 0.65 |
| Leg 1 | Sell Put, Delta 0.20, DTE 30, Qty 1 |
| Trading Frequency | Once a Month, Day of the month = 5 |
| Max Concurrent Trades | 2 |
| Take Profit % | 50 |
| Exit at DTE | 7 |
| Stop Loss % / Exit After Days / VIX Exit | blank |
Twelve monthly entries, twelve completed trades. The rest of this guide follows that run and the numbers it returns.
Step by step in MetisTrades
1. Open the tool
Go to Top nav → Research → Strategy Backtester. The page opens on Configure. The other tabs across the top are Queue, Results, History and Library.
2. Set the market window and sizing
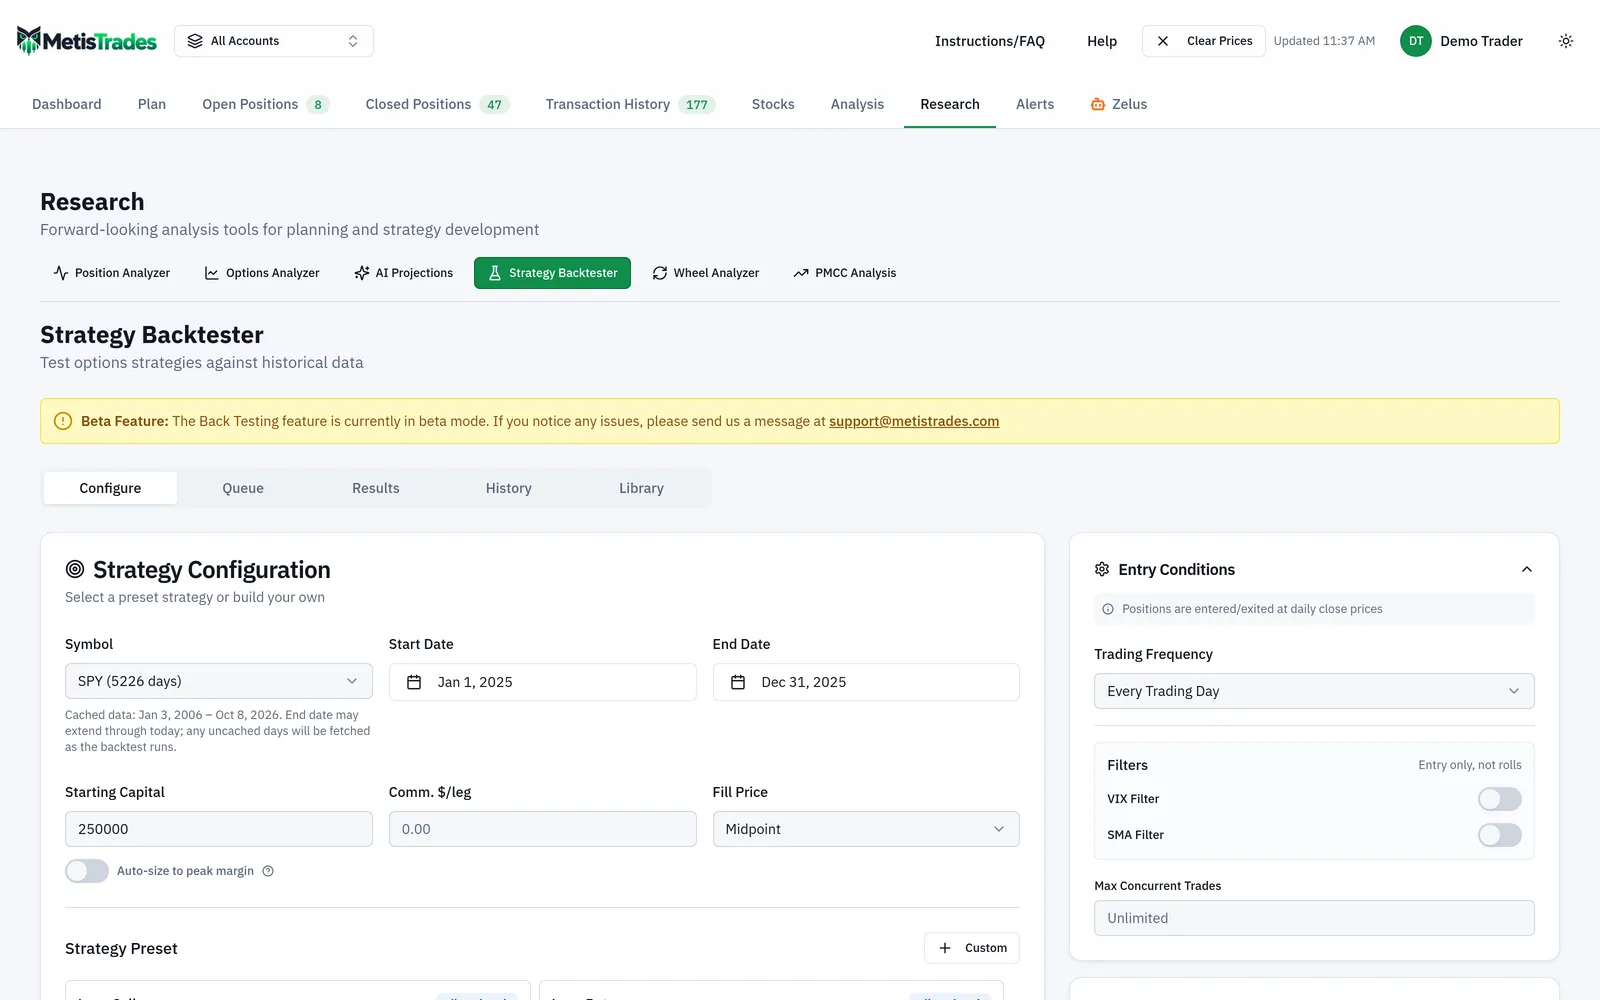
In Strategy Configuration, replace the initial setup — SPY, January 1, 2025 through December 31, 2025, with Starting Capital of 250000 — with your own. Enter XYZ as the Symbol, set Start Date to January 1, 2024 and End Date to December 31, 2024, and set Starting Capital to 50000.
Leave Auto-size to peak margin off for this run so the $50,000 capital base stays fixed and the percentage figures are easy to reason about. When that switch is on, the backtester sizes starting capital from peak buying power multiplied by the Buffer, which starts at 1.5x.
Set Comm. $/leg to 0.65 and change Fill Price from its default Midpoint to Bid/Ask + Slip. Midpoint is the friendliest assumption available; starting with the least friendly one tells you whether the idea survives a worse fill.
3. Choose the strategy and legs
Under Strategy Preset, pick a supplied preset or choose Custom and build the legs yourself. For a custom strategy each leg lets you choose Buy or Sell and Call or Put, then a strike selection method:
- Delta — target an option by delta.
- Offset $ — offset from the primary leg's strike.
- Underlying $ — offset from the underlying's current price, snapped to a nearby available strike.
For XYZ: one leg, Sell, Put, Delta 0.20, DTE: 30, Qty: 1. Add Leg would add a second leg if you were testing a spread; the remove control deletes a custom leg.
The screenshot below shows the Configure tab with the strategy and its legs laid out above the entry and exit sections. Look at how each leg carries its own direction, option type, strike selector, DTE and quantity, and at where the entry cadence and exit rules sit relative to them.
4. Set the entry cadence and filters
Entry Conditions states that positions are entered and exited at daily close prices. Under Trading Frequency choose Once a Month, then Day of the month and enter 5. A day-of-month entry accepts 1 through 31; if that day falls beyond a short month, the month's last trading day is used. The monthly schedule makes at most one entry per calendar month within the entry window.
The other cadences are Every Trading Day, Specific Days (Mon through Fri, with an optional Open on next trading day if market closed), and Exact DTE Match, where Target DTE requires an option with that exact DTE to be available.
Entry-only Filters include a switchable VIX Filter with Min VIX and Max VIX, and a switchable SMA Filter with SMA Period and a Condition of Price Above SMA or Price Below SMA. Leave both off for the first run so you are testing the cadence, not the cadence plus two filters. Set Max Concurrent Trades to 2; leaving it blank means unlimited.
5. Set the exit rules
Exit Conditions holds Take Profit %, Stop Loss %, Exit at DTE, Exit After Days and VIX Exit. None of these have enable toggles. A rule is active only when its field contains a value, and blank means inactive. Enter 50 in Take Profit % and 7 in Exit at DTE, and leave the rest blank.
If every exit field is blank, saved-run details describe the behavior as Hold to expiration — worth knowing, because an accidentally cleared field silently changes the strategy you thought you were testing. Roll Management is separate and does have its own switch; its triggers and guardrails apply only when that switch is on.
6. Run it, or queue a sweep
Run Backtest submits the current configuration. While work waits or runs, the button shows its queue position, estimated wait, or progress percentage. The adjacent Add to Queue action queues the configuration instead.
Delta and DTE fields, and each exit field, accept either one value or a comma-separated list for a queued sweep. If you enter 0.16,0.20,0.30 for delta and 30,45 for DTE, that is the Cartesian product of those values — six combinations — and the button changes to Add to Queue (6 runs). For regular users one sweep is capped at 50 runs. Add to Queue is disabled without a symbol and at least one leg, or when a sweep exceeds that cap.
The Queue tab contains Backtest Queue, where each row shows the symbol, strategy, date range, DTE, strike selector, relevant entry filters, roll policy and active exit conditions. Queued backtests keep running if you close the browser and come back later. With no work pending it shows Queue is empty.
How to read the results
The Results tab opens the selected run, the current run, or the latest visible saved run. Here is what the XYZ run returned, and what each figure is actually saying.
| Metric | XYZ run |
|---|---|
| Total P/L | $4,120 |
| CAGR | 8.2% |
| Win Rate | 83.3% (10 of 12) |
| Max Drawdown | $3,100 (6.2%) |
| Calmar Ratio | 1.33 |
| Max consecutive losses | 2 |
Total P/L of $4,120 is the simulated strategy's profit or loss over the window — after the 0.65 per leg commission and the Bid/Ask + Slip fill convention you chose. On a $50,000 capital base that is a return of 8.24%, and because the window is exactly one calendar year the CAGR — the compounded annual growth rate over the run's valid date span — lands at about the same 8.2%.
Win Rate is winning trades divided by completed winning and losing trades: 10 ÷ 12 = 83.3%. Read it next to the P/L split, not on its own. In this run the ten winners averaged $620 and the two losers averaged −$1,040 (10 × 620 = 6,200, less 2 × 1,040 = 2,080, giving $4,120). A high win rate sitting on top of a few large losses is the normal shape for short-premium strategies, and the summary's maximum consecutive losses figure of 2 tells you how many of those landed back to back.
Max Drawdown of $3,100, or 6.2%, is the largest peak-to-trough decline in the simulated equity curve. It is the number that tells you whether you could have sat through the run, not just whether it ended up. Calmar Ratio is CAGR divided by the absolute maximum drawdown percentage: 8.24 ÷ 6.2 = 1.33. Sharpe is an estimated return-per-unit-of-volatility measure from the available run data.
Return on Margin is Total P/L divided by average deployed margin, and it comes in two flavours. On All Days the average includes every trading day, including idle ones; if that average was $14,500, return on margin is 4,120 ÷ 14,500 = 28.4%. On Active Days the average includes only days with at least one open position; at $19,200 that is 4,120 ÷ 19,200 = 21.5%. The Active Days figure answers "how hard did the capital work while it was working"; the All Days figure answers "how hard did the whole allocation work".
The detail view also shows the saved configuration, capital and margin information, a buy-and-hold comparison when available, roll statistics when roll management was used, equity and performance views, and the run's trades.
The Trade Log table carries #, Entry, Exit, DTE, Legs, Reason, Entry Value, Exit Value, P/L and Data columns, with a Rolls column added when roll management was enabled. The Reason column is the one to study: it records why each trade closed. If few of the twelve trades closed on the take-profit, that level was rarely reached and is doing less work than you assumed. You can Export as CSV or Export as Excel, and expand eligible rows for Trade Details.
Two warnings outrank every metric above them. Trading Days Skipped Due to Missing Data appears when days could not be simulated, with the missing-day count and available breakdown; causes include missing stored data, no suitable DTE or delta match, missing delta, or no realistic strike. If three of your twelve months were skipped, you tested nine entries, not twelve, and the win rate is computed on that smaller sample. Margin Call Would Have Been Triggered appears if the simulated account breached the displayed maintenance requirement — a run that ends with a positive Total P/L and that warning is not a run you could have held through.
What none of these numbers mean: they are not a forecast, and they do not describe a trade you place tomorrow. They describe this rule set, on this symbol, over these dates, under these fill and commission assumptions.
Comparing saved runs honestly
Past Backtests on the History tab is the saved-run list. Filter by Symbol, Strategy and Filter by, where the numeric choices include Capital ($), Total P/L ($), Return on Margin (%), Max Drawdown (%) and Win Rate (%). Sort choices cover run date, P/L, return on capital, win rate, max drawdown, CAGR, Calmar Ratio and Sharpe Ratio, and Clear filters restores the unfiltered list.
Each saved row shows status, symbol, strategy, run date, tested date range, configuration details and completed metrics, with View Results, Re-run, Load Settings, favorite and delete actions. Use Re-run to repeat a saved setup unchanged, and Load Settings to restore it in Configure and edit it first. Failed runs show their failure reason and may offer Resume when a checkpoint exists, as well as Restart. Manage can delete runs older than 7, 30 or 90 days, all non-favorites, or all history.
For the six-run delta and DTE sweep, the scatter view compares completed runs on selectable axes such as CAGR, Max Drawdown, Return on Capital, Total P/L, Win Rate, Sharpe Ratio, Calmar Ratio and Total Trades. Plotting CAGR against Max Drawdown is more informative than reading Total P/L alone, because it shows what each extra point of return cost in decline. And when runs cover different date ranges, select them for P/L Comparison (Normalized), which aligns percentage change from starting capital by trading day so a nine-month run and a two-year run can sit on the same axis.
Limits and assumptions
The simulator uses daily close prices, not intraday execution. Entry Conditions says so directly: positions are entered and exited at daily close prices. A take-profit level that was touched intraday and gone by the close does not register.
Fill prices, commissions, margin, assignment behavior and liquidity assumptions can differ from a broker's actual execution. The three Fill Price conventions are models of a fill, not a fill. Quotes and market prices in MetisTrades are delayed or historical, not live.
Historical coverage differs by symbol. Available symbols and date limits come from the stored-data list shown to you. In a restricted non-admin view, Start Date must stay within the selected symbol's displayed cached range; End Date can extend from that range through today, and uncached days may be fetched while the run executes. The date picker never allows a future end date in that view, and the start must be before the end. Missing days, unavailable contracts and unmatched DTE or delta selections can reduce the simulated sample — which is why the skipped-days warning matters more than it looks.
Backtests consume paid historical market data and run through a queue. The interface shows queue position and estimated wait when available, but it does not promise a fixed completion time. For regular users a comma-separated sweep can queue at most 50 combinations at once.
Backtest results are hypothetical estimates. They are not investment advice. The page is a beta feature, so review the skipped-day and margin warnings on every run before you compare it with another one. Options carry real risk of loss, and a simulated drawdown you shrug at on screen is a different experience in a live account.
Common mistakes
- Assuming Take Profit and Stop Loss need switching on. They have no toggles, so a blank field means the rule never fires — enter a value to activate it.
- Clearing every exit field by accident. The run then behaves as Hold to expiration; check the saved-run details for that phrase before reading the metrics.
- Reading the summary past a skipped-days warning. Trading Days Skipped Due to Missing Data means fewer entries than you configured — read the count and breakdown first, then decide whether the sample is worth interpreting.
- Treating Midpoint fills as what you would have got. Re-run the same configuration with Bid/Ask + Slip and a realistic Comm. $/leg and compare the two Total P/L figures.
- Ignoring Margin Call Would Have Been Triggered because the run was profitable. That warning means the simulated account breached the displayed maintenance requirement during the window; size the run down or lower Max Concurrent Trades and test again.
- Running a sweep and keeping only the top Total P/L. Open the scatter view, plot CAGR against Max Drawdown, and check maximum consecutive losses on the candidate before you trust it.
- Comparing runs with different date ranges by raw P/L. Select them in History and use P/L Comparison (Normalized), which aligns each run by trading days from its own start.
Related guides and help pages
Related guides
- Plan, Track, Optimize: a complete tour of MetisTrades
- Building and Stress-Testing a Trade in the Position Analyzer
- Screening a Watchlist with the Options Analyzer
- Reading one symbol in depth: the Options Analyzer deep dive
- Replaying one options trade with Trade Backtest
- Testing Wheel Settings With the Wheel Analyzer