Testing Wheel Settings With the Wheel Analyzer
The Wheel Analyzer runs wheel-strategy settings against stored historical options data, then lets you compare completed runs. This guide walks through one XYZ comparison, the setup steps, and how to read the output honestly.
What it does and when to use it
The wheel is a repeating options routine. You sell a cash-secured put — a put you have set aside enough cash to honour, which obliges you to buy 100 shares at the strike if the holder exercises. If you are assigned, you own the shares. You then sell covered calls against those shares — short calls backed by stock you already hold — until the shares are called away at a call's strike. Then you start again.
Every one of those steps involves a choice: how far out of the money to sell, how many days to expiration, whether to close early at a profit target, and which strikes you are willing to use once you hold stock. The Wheel Analyzer answers one question about those choices: on this symbol, over this historical period, what would these settings have produced, and how does that compare with a different set of settings?
It is for someone who already understands the wheel and wants evidence rather than intuition about one rule change. The page keeps a Queue of submitted work and a History of prior runs, so the real value is comparison across several completed runs rather than any single number.
Terms the page leans on:
- Delta — the option's sensitivity to a $1 move in the underlying, used here as a proxy for how far out of the money you want to sell. A 0.30 delta put sits further from the money than a 0.45 delta put.
- DTE — days to expiration targeted when the simulation opens a position.
- Profit % — the share of maximum option profit that triggers an early close. 100% means hold to expiration in this simulation.
- Cost basis — what the assigned shares are recorded as costing you, which matters because one strike-selection mode refuses to sell calls below it.
- Max Drawdown — the largest peak-to-trough decline during the simulation.
Wheel Analyzer is pro-flagged: you need Pro access and the site research/backtesting feature flag. An anonymous visitor can reach the Research area but sees Sign In Required on this page, with a Sign In button and a Start Free Trial link.
A worked scenario
You have been wheeling XYZ and you keep hesitating over one rule: when you own assigned shares, should you only sell calls above your cost basis, or sell at your delta target regardless? Selling above basis avoids locking in a loss on the stock; selling at the delta target collects more premium.
Rather than argue about it, you run both. Every input is identical except Strike Selection Mode:
- Symbol: XYZ
- Start Date: January 1, 2024 · End Date: December 31, 2024
- Starting Capital: $50,000 · Contracts Per Cycle: 1
- Cash-Secured Put (CSP) Phase: Delta 0.30, DTE 45, Profit % 100
- Covered Call (CC) Phase: Delta 0.30, DTE 30, Profit % 100
- Strike Selection Mode: Run A uses Above Cost Basis (Safe), Run B uses Chase Price (Aggressive)
Both finish, and the completed runs summarize like this:
| Result | Run A — Above Cost Basis | Run B — Chase Price |
|---|---|---|
| Total P/L | $3,420 | $4,105 |
| Return | 6.84% | 8.21% |
| Completed Cycles | 2 | 3 |
| Win Rate | 78% | 71% |
| CSP Premium | $1,860 | $1,860 |
| CC Premium | $1,240 | $1,705 |
| Stock P/L | $320 | $540 |
| Max Drawdown | 7.10% | 9.40% |
The arithmetic ties out. Run A: $1,860 + $1,240 + $320 = $3,420, and $3,420 ÷ $50,000 = 6.84%. Run B: $1,860 + $1,705 + $540 = $4,105, and $4,105 ÷ $50,000 = 8.21%. The CSP Premium is identical in both because the put phase rules were identical; the only place the two configurations could diverge is the covered-call phase and whatever followed from it.
Step by step in MetisTrades
1. Open the page
Go to Top nav → Research → Wheel Analyzer, or open /research/wheel directly. The page opens on the Configure tab, headed Wheel Strategy Analyzer.
2. Pick the symbol and date range
For non-admins, the Symbol control is restricted to symbols that have stored historical option quotes, and the menu shows each available ticker with its number of trading days. The Start Date and End Date calendars are restricted to that symbol's displayed data range. Check the trading-day count before you commit to a range: it is the quickest signal of how much data your run has to work with. Symbol defaults to SPY for an unrestricted view, Start Date to January 1, 2024 and End Date to December 31, 2025.
3. Set capital and the two phases
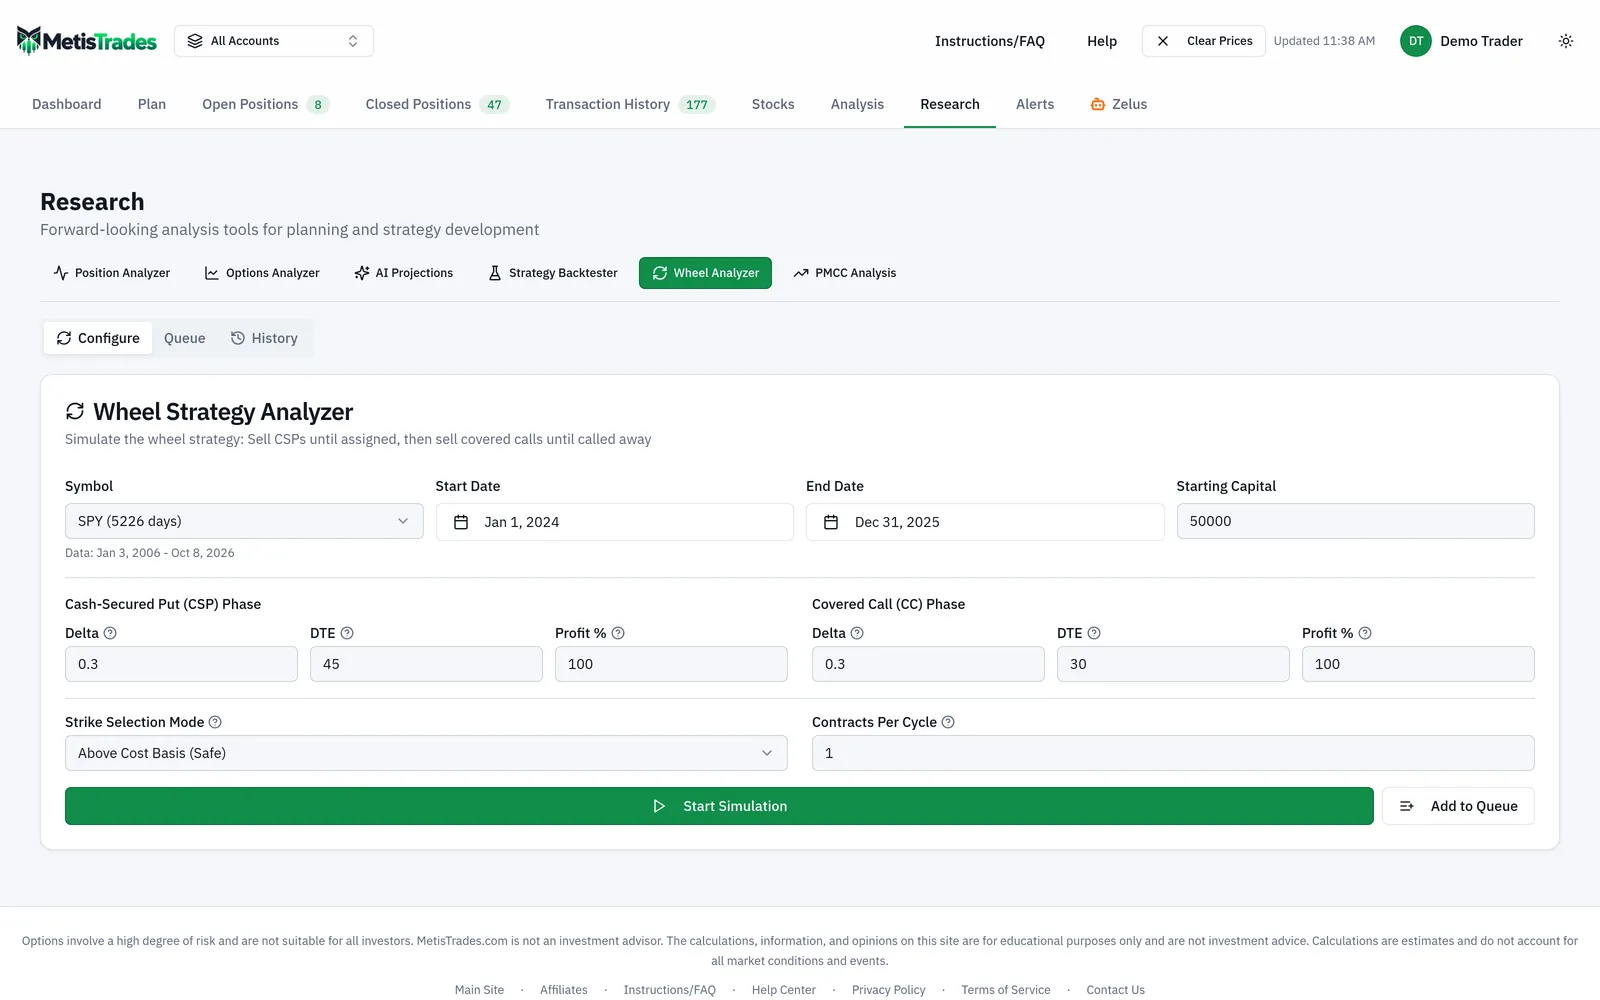
Set Starting Capital (default $50,000) and Contracts Per Cycle (default 1). Then fill the Cash-Secured Put (CSP) Phase — Delta 0.30, DTE 45, Profit % 100 by default — and the Covered Call (CC) Phase — Delta 0.30, DTE 30, Profit % 100 by default. For the scenario above, leave all six at their defaults.
The screen below is where the whole comparison is defined. Look at how the two phases are separated, and at the strike-selection control underneath them, since that is the single input the worked scenario changes.
4. Choose the strike selection mode
Strike Selection Mode controls covered-call strike selection and offers three options. Above Cost Basis (Safe) only sells calls above cost basis. Chase Price (Aggressive) uses a delta-appropriate strike regardless of cost basis. Hybrid (Time-based Switch) begins above cost basis, then switches to the aggressive approach; choosing it adds Days Before Switch, which defaults to 60. Run A uses the first, Run B the second.
5. Start the first run, queue the second
Use Start Simulation to begin when capacity is available. Start Simulation is disabled while another run is pending, queued or running, so submit the second configuration with Add to Queue instead of waiting at the screen. While a run is active, Current Simulation shows its status, queue message or completion percentage. The cancel control removes a waiting run or cancels an active one.
6. Watch the Queue
The Queue tab contains Simulation Queue. It is a shared queue across simulation types, and submitted work continues if you close the browser. Each item shows its queue number, symbol, simulation type, date range and a Starting, Waiting or percentage status. With nothing pending the page says Queue is empty.
7. Read the runs in History
The History tab contains Simulation History with total and completed run counts. In List view you can sort by Date, P/L, Return, Premium, Win Rate, Max DD or Cycles, each highest-first or lowest-first. Open Configuration on a run to review the exact settings it used — do this before you trust any comparison. Open View Details to switch between Equity Chart and Trades.
8. Compare in Scatter
Choose Scatter in Simulation History. You need at least two completed simulations. The Preset choices are Risk-Adjusted Returns, Premium Efficiency, Consistency vs Profitability, Cycles vs Returns and Custom. Click a point to select it and Shift-click to add another run.
How to read the results
Total P/L and Return. Run B's $4,105 beats Run A's $3,420 by $685. Return restates the same thing against capital — 8.21% versus 6.84% — and is the figure to compare when two runs started with different Starting Capital. Neither number is a forecast; both describe what these rules produced on stored historical data for XYZ over 2024.
CSP Premium, CC Premium and Stock P/L. These three decompose Total P/L. The put phase contributed the same $1,860 in both runs because its inputs were identical. The difference sits in CC Premium ($1,240 versus $1,705, a $465 gap) and Stock P/L ($320 versus $540, a $220 gap). Since the only configuration difference was the covered-call strike rule, the gap traces back to that rule and nothing else. That is the whole point of changing one input at a time.
Completed Cycles. A cycle is a put phase followed by a call phase, completed when the shares are called away. Run A completed 2, Run B completed 3. Read this alongside the premium figures: more cycles mean more opening trades in the same window, which is one explanation for Run B's larger CC Premium. It does not tell you anything about the quality of those cycles on its own.
Win Rate. Run A recorded 78%, Run B 71%. A higher win rate with lower total profit is a common pattern and not a contradiction — the share of trades recorded as winners says nothing about how large the winners and losers were. Always read it next to Total P/L and Max Drawdown.
Max Drawdown. Run A fell 7.10% from a peak at its worst; Run B fell 9.40%. If you divide return by drawdown with a pencil, Run A returned 0.96% per point of drawdown (6.84 ÷ 7.10) and Run B 0.87% (8.21 ÷ 9.40). The Risk-Adjusted Returns preset plots exactly those two axes — Return (%) against Max Drawdown (%) — so this trade-off is visible as the position of each point rather than as arithmetic.
Equity Chart and Trades. View Details switches between the Equity Chart and the Trades table. The Trades table lists every simulated trade with Type, Strike, Expiration, Entry, Exit, Days, Exit Reason, Entry Value, Exit Value and P/L. If a summary number surprises you, this table is where you check it: scan Days to see how long positions were actually held against your DTE target, and use Exit Reason to see how each trade was closed out.
What none of it means. A better number here does not mean the rule is better for your account. It means that rule, on that symbol, over that window, with those stored quotes, produced that figure. Change the symbol or the year and the ranking can reverse.
Limits and assumptions
Results are historical simulations, not predictions or investment advice. Coverage depends on stored historical options data, and a completed run can contain no trades at all — when that happens the page warns that historical options data may not be available for that symbol and date range.
The inputs are bounded, and those bounds define what you can test. The symbol must be 10 characters or fewer and the date range must cover at least 30 days. Starting capital must be at least $1,000 and less than $10,000,000. Contracts Per Cycle must be from 1 through 100. Both delta targets must be from 0.10 through 0.50, both DTE targets from 7 through 90 days, and both profit targets from 10% through 100%. Days Before Switch must be from 1 through 365 when Hybrid mode is selected. A rule you cannot express inside those ranges is a rule this tool cannot test.
Non-admin access is limited to symbols with stored historical option quotes, with dates limited to each symbol's available range; admins can type a symbol instead of selecting from that restricted list. If the symbol you actually trade is not in the menu, a run on a different ticker is a different question, not a stand-in.
The simulation models one wheel with a fixed contract count and fixed rules for the whole period. It does not represent position sizing you adjust by hand, discretionary skipped weeks, or anything you did outside the configured rules. Treat the output as a test of the rule set you typed in, nothing wider.
Common mistakes
- Changing several inputs between runs. If delta, DTE and strike mode all moved, the difference in Total P/L cannot be attributed to any one of them — change one input per run and leave the rest alone.
- Waiting at the screen because Start Simulation is greyed out. It is disabled while another run is pending, queued or running; use Add to Queue and come back, since submitted work continues after you close the browser.
- Judging a configuration on Win Rate. 78% with $3,420 lost to 71% with $4,105 in the scenario above — read Win Rate next to Total P/L and Max Drawdown, never alone.
- Comparing dollar P/L across different Starting Capital. Sort or plot by Return (%) instead so the comparison is like for like.
- Expecting Profit % 100 to close trades early. In this simulation 100% means hold to expiration; set a lower figure, within 10% to 100%, if you want an early-close rule tested.
- Assuming an empty run means the settings failed. A run with no trades usually means the symbol and date range lacked stored historical options data — check the trading-day count in the Symbol menu and retry inside the available range.
- Clearing History without thinking. Delete All Simulations removes the runs you were comparing, and the Scatter view needs at least two completed simulations to draw anything; prefer the older-than-7, 30 or 90 day options.
Related guides and help pages
Related guides
- Plan, Track, Optimize: a complete tour of MetisTrades
- Assigned at $100 with the stock at $85: where do you sell the first call?
- Building and Stress-Testing a Trade in the Position Analyzer
- Screening a Watchlist with the Options Analyzer
- Reading one symbol in depth: the Options Analyzer deep dive
- Backtesting an Options Strategy with the Strategy Backtester