Building and Stress-Testing a Trade in the Position Analyzer
Build an options position leg by leg in the MetisTrades Position Analyzer, test it against price, time and volatility changes, and read the payoff numbers without over-reading them.
What it does and when to use it
The Position Analyzer is a strategy workspace. You assemble one or more option legs, plus an optional stock leg, and the page shows how that combination may behave as the underlying price, the date and implied volatility change.
It answers a question that comes up before almost every options trade: what does this structure actually pay, and where does it hurt? It does not place, close or roll trades at a broker. It shows you the shape of a position you describe to it.
A few terms the tool leans on, in plain words:
- Leg — one stock or option part of a position. A put credit spread has two option legs.
- Strike — the fixed price at which a call holder may buy, or a put holder may sell, if the contract is exercised.
- Net debit/credit — premium paid for long legs minus premium collected for short legs, multiplied by 100 per contract and combined across the position. Money in is a credit; money out is a debit.
- Breakeven — an underlying price where profit or loss at expiration equals zero.
- Implied volatility (IV) — the level of future movement implied by an option's market price. It is not a direction forecast.
- Delta — the approximate change in the position's value for a $1 move in the underlying, expressed in share-equivalent units.
Use it when you are sizing up a structure you have not traded before, when you want to see what a wider or narrower strike does to the payoff, when you want to compare holding to expiration against closing early, or when you want to send someone the exact setup you are looking at.
There are two versions of the same analyzer. The in-app version sits under Research at /research/analyzer (Top nav → Research → Position Analyzer). The public version at /analyzer (Free nav → Position Analyzer) has its own MetisTrades header and footer and is designed to work without signup. The core builder, the P/L chart, the heatmap, the expiration payoff facts, Delta and the sharing controls are available on the public page. Probability of profit, expected value, tail risk, chance of touching short strike, return on risk / yr, stop-out chance and price, Gamma, Theta, Vega, Rho, Greek chart and heatmap modes, Auto-optimize strikes and Best close plan for these legs require Pro; non-Pro visitors see locked values or a blurred preview with an upgrade link.
A worked scenario
XYZ is trading at $98.40. You are considering a put credit spread 45 days out: sell the 95 put, buy the 90 put, one contract each. On the chain, the 95 put shows a bid of $1.90 and an ask of $2.00; the 90 put shows a bid of $0.75 and an ask of $0.85.
Work the entry out by hand first. With Natural pricing — ask for a leg you buy, bid for a leg you sell — you collect the 95 put's bid of $1.90 and pay the 90 put's ask of $0.85:
$1.90 − $0.85 = $1.05 per share. One contract represents 100 shares, so the Net debit/credit is a credit of $105.
The spread is five points wide: $95 − $90 = $5.00, or $500 per contract. Your structural risk is the width minus the credit:
$500 − $105 = $395 max loss.
Breakeven at expiration is the short strike minus the credit per share: $95.00 − $1.05 = $93.85. Credit as a share of width is $105 ÷ $500 = 21%.
| Figure | Natural pricing | Mid pricing |
|---|---|---|
| Short 95 put premium | $1.90 (bid) | $1.95 (mid) |
| Long 90 put premium | $0.85 (ask) | $0.80 (mid) |
| Net credit (1 contract) | $105 | $115 |
| Max profit | $105 | $115 |
| Max loss | $395 | $385 |
| Breakeven | $93.85 | $93.85 − $0.10 = $93.75 |
| Credit / width | 21% | 23% |
That $10 difference between price modes is the whole reason the analyzer makes you choose one. The rest of this guide builds the Natural version.
Step by step in MetisTrades
1. Load the symbol
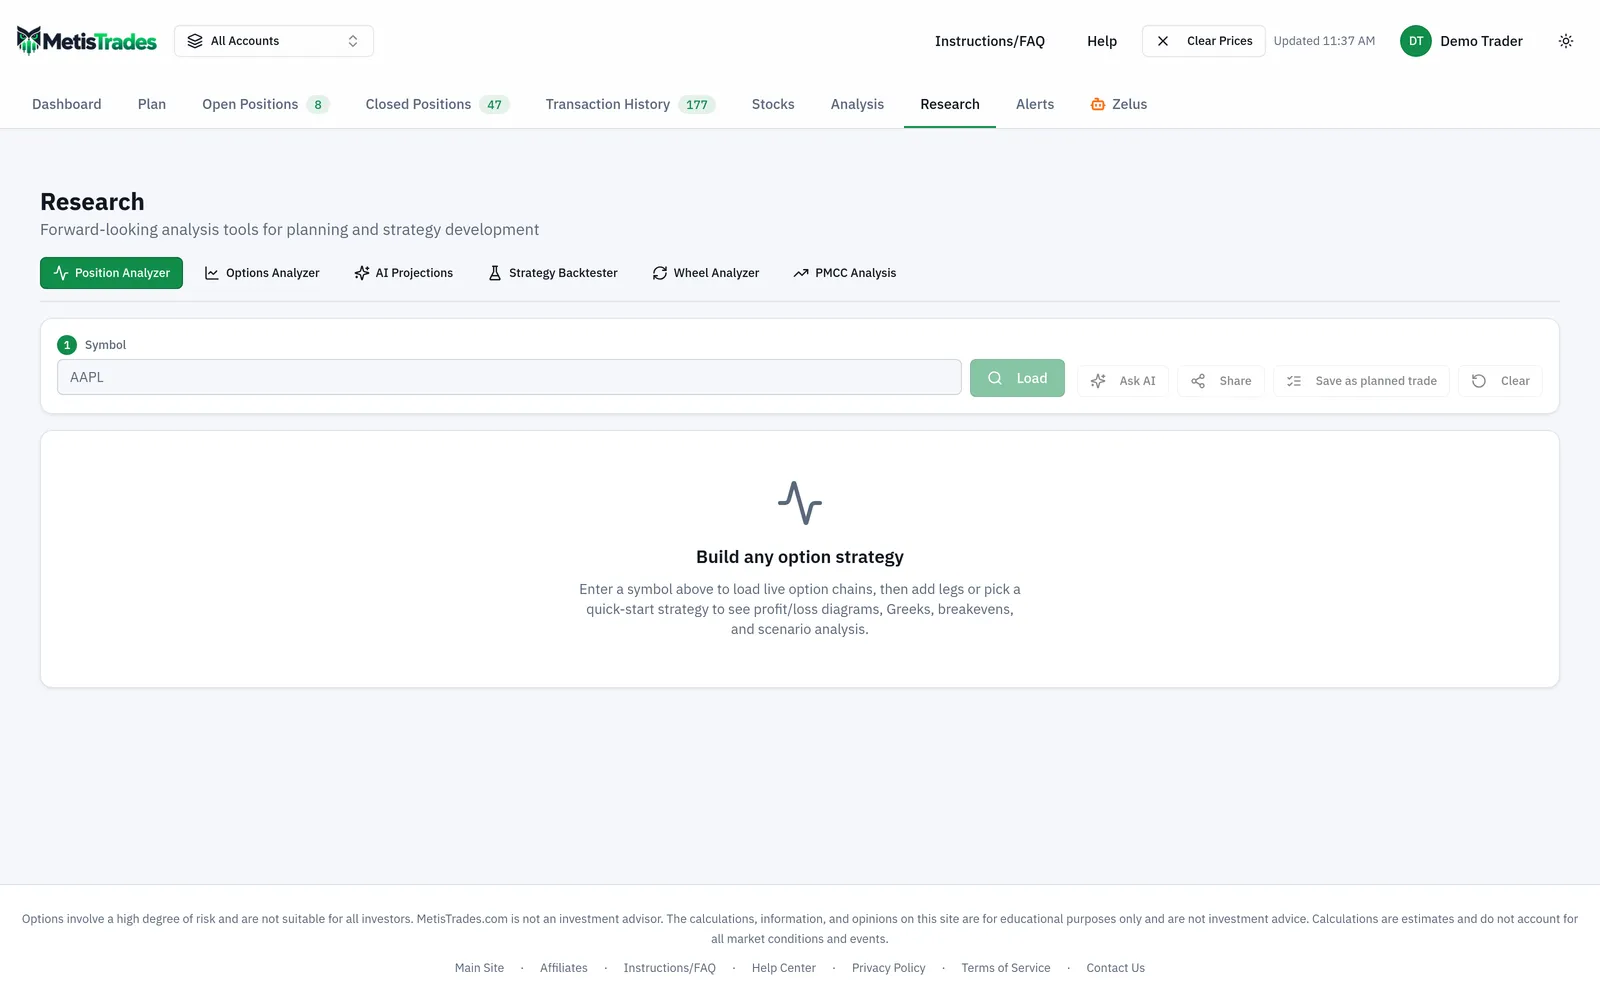
Open the Position Analyzer, enter XYZ in Symbol and select Load. The page shows the Underlying price when data is available — $98.40 here. Before you load anything the empty state reads Build any option strategy and points you to enter a symbol, add legs, or use a quick-start strategy.
2. Choose a starting structure
After the symbol loads you can apply a quick-start strategy, which creates the appropriate legs from available expirations and strikes, or build the position yourself. For a two-leg spread, building it by hand is quick and teaches you where every field lives.
3. Add the legs
Select Add leg and choose Option leg. Set Side to Sell (short), Type to Put, pick the 45-day Expiration, set Strike to 95, Quantity to 1, and check Price (per share) and IV (%). Available quote detail appears as Bid, Mid and Ask. Select Add leg to confirm. Repeat for the long 90 put with Side set to Buy (long).
Two things to keep straight. For options, quantity means contracts, and one contract represents 100 shares. Entry premiums are entered per share — $1.90, not $190 — while option P/L applies the 100-share multiplier for you. If you wanted shares in the picture instead, Stock (100 shares) adds a stock leg; only one is allowed, and in the rail you set it Long or Short, edit Shares and change its entry value. Stock payoff uses shares directly, with no contract multiplier.
4. Set the price mode
The Price choice controls which chain price is used for current leg values and new entries. Mid is the bid/ask midpoint; Natural is the ask for a long leg and the bid for a short leg, a less favourable but more conservative fill assumption. Natural is the default and your choice is remembered in the browser. If the available bid/ask spread is stale from a prior session, the page forces Mid and hides Natural rather than treating that stale spread as a fill.
5. Check the legs in Rail and Table
Rail is the default editable view: each option leg sits on one shared price axis, and you drag a handle to a listed strike or select it to edit Buy, Sell, Call, Put, Expiration, Contracts and Entry price. The rail starts at 10% zoom and its Zoom control spans 2% to 50%. Switch to Table for the dense list, whose base columns are Side, Type, Expiration, Strike, Qty, Entry, Current and P/L. The Columns menu can add Delta, Gamma, Theta, Vega, Rho, IV, Volume and Open Interest; non-Pro users can expose those columns, but the non-Delta Greek cells stay locked.
Look at the two strike handles on the rail's shared price axis, and at the strategy stats building up alongside them.
6. Set the close policy
The Close: controls decide what horizon everything is modelled to. Expiry holds every leg to the earliest expiration and is the default. At DTE models closing a chosen number of calendar days before that expiration; it starts at 21 days where possible and cannot be set beyond one day before expiration. Profit target models an exit when unrealized P/L reaches a percentage of expiration max profit; it starts at 50% and accepts 1% to 99%, and in that mode stop at loss of can add a stop measured as a percentage of credit, staying off until you enter a positive value.
Set a 50% profit target on the XYZ spread and the page keeps Max profit at $105 under Payoff at expiration, then adds Profit-target exit at $52.50 — half of $105 — as the amount you plan to bank.
7. Stress the position
On the Profit / loss diagram, the solid green and red curve is At expiration and the dashed curve is Today, or the future date you pick with Days forward. Spot marks the latest available underlying price and BE marks the expiration breakeven at $93.85. Move IV adjustment between −50 and +100 volatility points to model a volatility change, and use Range to widen or narrow the displayed price span from 0.5% to 250%. You can show P/L in dollars, as a percentage of maximum P/L, or as a percentage of Risk; the Risk choice is disabled when no positive maximum-risk amount can be calculated.
Select Table beside Graph for the Profit / loss heatmap: rows are underlying prices, columns are dates starting with Today, and option-expiration columns are emphasised. Each cell applies that date, that price and the current IV adjustment to the whole position; green is positive, red is negative, stronger colour means larger magnitude. If the inputs are insufficient the empty state reads Not enough data to render the heatmap.
8. Share the setup
Share copies a URL. When every option leg has a valid mark and the underlying price is available, the link is a frozen snapshot that is viewable without an account, and the confirmation reads Snapshot link copied — viewable without an account. If current marks are incomplete, the analyzer shares the legs only and warns Current prices unavailable — sharing legs only (recipient needs an account). The copied URL preserves the close policy and a stock leg if you added one.
How to read the results
Payoff at expiration restates your pencil arithmetic: Net debit/credit of $105 credit, Breakevens at $93.85, Max profit $105, Max loss $395, and Credit / width 21% because this is a capped-loss credit position. These are structural facts about the payoff curve, not forecasts. Max profit shows Unlimited when upside grows without bound, and max loss shows Unlimited when loss can keep growing as the underlying rises; neither applies to a defined-width spread.
Read Max loss as the amount the structure can lose at expiration if XYZ finishes at or below $90. It is not a prediction of how the trade ends, and it does not shrink because you set a stop — the stop changes the modelled path outcomes, while the expiration structure stays what it is.
Probabilities & outlook holds the Pro metrics and names the active close policy, so every figure in it is tied to the horizon you chose. Suppose with the 50% profit target the panel shows Probability of profit 78%, Expected value $19, Tail risk (avg worst 5%) −$311, Chance of touching short strike 31% and Return on risk / yr around 16%. Each means something narrow:
- Probability of profit is the estimated chance the position is profitable at the active close horizon, from current implied volatility, time and a lognormal price model. It says nothing about how large the win or the loss would be.
- Expected value is the probability-weighted average P/L at that horizon. A positive $19 means favourable on average across the modelled outcomes; it is not the result of any single trade.
- Tail risk (avg worst 5%) is the average result among the worst 5% of modelled outcomes — conditional value at risk, or expected shortfall. It describes the bad tail on average rather than one specific point on it.
- Chance of touching short strike estimates whether XYZ reaches $95 before the close horizon, not merely whether it finishes below it. That is why 31% can sit alongside a 78% probability of profit: touching and finishing are different events.
- Return on risk / yr is expected value divided by capital at risk, scaled from the modelled holding window to one year. Annualising a 45-day window magnifies small numbers, so treat it as a comparison aid between setups rather than a rate you expect to earn.
Position Greeks and IV aggregates exposure across all legs, signed for long or short direction and scaled by quantity. A net Delta of, say, +12 means the position behaves roughly like 12 shares of XYZ for a small move. Position IV is quantity-weighted across the option legs; stock has no IV.
On the diagram, the gap between the dashed Today curve and the solid At expiration curve is remaining time value. Drag Days forward to 30 and watch the dashed curve settle toward the solid one near the short strike — that is time decay made visible. Push IV adjustment to +10 and the dashed curve for a credit spread typically sags; that is the vega exposure you took on by selling premium.
A deep red cell at $85 and a green cell at $99 are both scenario calculations. Like the diagram, the heatmap does not predict where the underlying will go.
Limits and assumptions
Quotes in MetisTrades are delayed. A displayed underlying price, option mark, bid, ask or IV is the latest available value, and an actual fill can be better or worse. Mid and Natural are pricing assumptions, and a stop can be exceeded during a gap.
When complete market data is unavailable, option values and Greeks can use Black-Scholes estimates; the page marks values as estimated where applicable.
Probability of profit, expected value, touch probability, tail risk, stop-out chance and annualised return are model estimates, not guarantees. Probability of profit, for example, uses current implied volatility, remaining time and a lognormal price model. Change the close policy and they change with it. The heatmap and diagram are scenario calculations; they do not predict the underlying's future path.
Expiration calculations use the earliest option expiration as the main horizon. If you build a calendar or diagonal, the later-dated leg retains modelled time value at that point rather than settling — worth remembering before reading a calendar's "max profit" too literally.
Unlimited means the theoretical payoff is unbounded in one direction. The visible chart range is a display setting, not a risk limit.
Shared snapshots freeze prices and Greeks at the moment the link was created and display Snapshot from with a timestamp. They do not update until an eligible signed-in viewer selects Refresh with current prices. A signed-out recipient can inspect the frozen setup, payoff and snapshot values, but Refresh with current prices is disabled with the message Sign in to refresh with current prices. While a setup is a snapshot its editing controls are hidden and the page says Strategy is locked while viewing a shared snapshot. Click "Refresh with current prices" above to edit.
The analyzer does not place, close or roll trades at a broker. The roll simulator is admin-only while under internal testing, so Pro users and anonymous visitors do not see Roll leg, roll history or the pre-roll comparison. Nothing on the page is financial, investment or tax advice.
Common mistakes
- Entering premium in contract dollars. Typing 190 instead of 1.90 inflates every figure by 100× — the field is Price (per share), and the 100-share multiplier is applied for you.
- Reading Max profit as the amount you will bank with a target set. With a 50% target, Max profit stays $105 and Profit-target exit shows $52.50; read the second number for the modelled exit.
- Assuming a stop reduces risk on the page. Structural Max loss stays at $395 because it describes the expiration payoff; the stop only changes modelled path outcomes.
- Mixing price modes without noticing. Natural is the default and is remembered in your browser, so a position built last week on Mid can look different today — check the Price setting before comparing two setups.
- Judging the trade on Probability of profit alone. Read it beside expected value, tail risk, max loss and credit / width, since a high PoP can sit alongside a large loss when it fails.
- Treating the chart edges as worst case. Range is a display span from 0.5% to 250%; widen it before deciding you have seen the whole payoff.
- Sending a link and expecting it to track the market. A snapshot is frozen at its timestamp; tell the recipient the setup is as of that moment, and refresh it yourself when you revisit.
Related guides and help pages
Related guides
- Calls and Puts: What an Option Contract Actually Is
- Reading a payoff diagram: profit and loss at expiration
- The Greeks in practice: delta, theta, vega and gamma
- Vertical spreads: defined-risk option trades
- Plan, Track, Optimize: a complete tour of MetisTrades
- Short put deep in the money with a week left: assign, roll, or close?