Reading a payoff diagram: profit and loss at expiration
A payoff diagram is just a table of expiration outcomes drawn as a line. Work one out by hand for a short put and a long call, find the breakevens, then see where the same curve appears in the MetisTrades Position Analyzer.
What it is and why it matters
A payoff diagram is a picture of one question: if the underlying stock finishes at price X on expiration day, what is this position worth in dollars? The horizontal axis is the stock price. The vertical axis is profit or loss. The line is the answer at every price.
Behind the picture is nothing more than a table of numbers, and you can build that table with a pencil. To do it you need five terms.
- Strike — the fixed price at which a call holder may buy, or a put holder may sell, if the contract is exercised.
- Premium — the price of the option, quoted per share. A $1.50 premium on a standard equity contract is $150 of cash.
- Contract size — the number of shares one contract represents. Standard equity options usually use 100, but mini options use 10 and futures options use a broker-supplied multiplier, so do not assume 100 without checking.
- Intrinsic value — what the option would be worth if exercised right now: the amount a call is above its strike, or a put is below its strike, with a floor of zero.
- Extrinsic value — anything the option is worth above intrinsic value, reflecting remaining time and implied volatility. By expiration it has decayed away, which is exactly why the expiration payoff is easy to calculate: only intrinsic value is left.
Three readings matter most on the finished diagram. The breakeven is a price where profit or loss equals zero — where the line crosses the axis. Max profit is the highest point the expiration line reaches. Max loss is the lowest. Knowing those three before you place a trade tells you what the position is structurally capable of, which is a different question from how likely any outcome is. Options carry real risk of loss, and a payoff diagram is the cheapest way to see the size and shape of that risk.
Work it out by hand
Take two single-leg positions on a stock called XYZ, each one contract, each priced at expiration so only intrinsic value remains:
- A short 50 put, sold for 1.50 per share.
- A long 55 call, bought for 2.00 per share.
Step 1: value each option at expiration
At expiration an option is worth its intrinsic value and nothing else.
The 50 put is worth 50 − price when the stock is below 50, and zero otherwise. At a stock price of 40 that is 50 − 40 = 10. At 45 it is 5. At 48.5 it is 1.5. At 50 and anywhere above, it is 0.
The 55 call is worth price − 55 when the stock is above 55, and zero otherwise. At 57 that is 2. At 60 it is 5. At 55 and anywhere below, it is 0.
Step 2: compare that value with the premium
You sold the put for 1.50, so your result per share is 1.50 − put value. You bought the call for 2.00, so your result per share is call value − 2.00. Selling means the premium is on your side of the ledger; buying means it is a cost you have to earn back.
Step 3: apply the contract multiplier
Multiply the per-share result by 100 for a standard equity contract. At a stock price of 40, the short put is (1.50 − 10) × 100 = −850. At 60, the long call is (5 − 2.00) × 100 = +300.
Doing that at seven prices gives the whole table. P/L is per position, in dollars.
| XYZ at expiration | Short 50 put value | Short put P/L | Long 55 call value | Long call P/L |
|---|---|---|---|---|
| 40 | 10 | -850 | 0 | -200 |
| 45 | 5 | -350 | 0 | -200 |
| 48.5 | 1.5 | 0 | 0 | -200 |
| 50 | 0 | 150 | 0 | -200 |
| 55 | 0 | 150 | 0 | -200 |
| 57 | 0 | 150 | 2 | 0 |
| 60 | 0 | 150 | 5 | 300 |
Step 4: read the three key numbers off the table
Breakevens. The short put row that reads zero is 48.5, and you can get there without the table: strike minus premium, 50 − 1.50 = 48.50. The long call row that reads zero is 57, which is strike plus premium, 55 + 2.00 = 57.00. Those are the crossing points you would mark on the chart.
The flat sections. Above 50 the short put column stops changing: every row reads +150, the credit collected. Below 55 the long call column reads −200 at every price, the full debit paid. Flat sections are where further movement in your favour adds nothing.
The sloped sections. Below 48.5 the short put loses roughly $100 for each dollar the stock falls: −350 at 45, −850 at 40. That slope continues down toward a zero stock price, where the loss would be largest. Above 57 the long call gains about $100 per dollar: 0 at 57, +300 at 60, and the table simply runs out of rows rather than reaching a ceiling.
The seven rows above, and the formulas that produce the four computed columns, are in the spreadsheet below. Change the price column to test any other price.
Download the template: Payoff table spreadsheet (.xlsx). It opens in Excel, and in Google Sheets via File → Import. The worked example from this guide is already filled in, and the formulas carry down into the blank rows.
What changes the outcome
Change one input at a time and watch which part of the table moves.
The stock price. This is the axis itself. Moving XYZ from 45 to 40 takes the short put from −350 to −850: a $5 move costs $500 because each point is worth 100 shares.
The premium. Sell the same 50 put for 2.50 instead of 1.50 and every short-put row improves by $100: the flat section becomes +250 and the breakeven drops from 48.50 to 47.50. More premium received pushes the breakeven further from the strike; more premium paid pushes it further away in the other direction.
The strike. Buy the 50 call instead of the 55 call, still for 2.00, and the sloped section starts five points lower. At a stock price of 57 you would hold 7 points of intrinsic value instead of 2, and the breakeven moves from 57 to 52. Strike choice moves the bend in the line; premium moves the line up or down.
Size. Three contracts instead of one multiplies every P/L figure by three: −850 becomes −2,550, +150 becomes +450. The breakevens do not move at all. Size scales the vertical axis only.
Contract size. If the contract represented 10 shares rather than 100, the short put at 40 would be (1.50 − 10) × 10 = −85. Same shape, one tenth the dollars. Always confirm the multiplier before trusting the dollar figures.
Time remaining. Everything above assumes expiration day. Before expiration the options still carry extrinsic value, so the line is a smooth curve rather than a set of straight segments with a sharp bend. With 30 days left, the long 55 call at a stock price of 55 is not worth zero — it still has time value — so the curve sits above the −200 floor and sags toward it as the days pass.
Implied volatility. IV is the movement level implied by an option's market price. It does not change the expiration table at all, because expiration value is pure intrinsic value. It does change the pre-expiration curve: higher IV lifts the value of both options, which helps a long position's mark and hurts a short position's cost to close.
Fees. Commissions and exchange fees are not in the table. If you paid $1.30 per contract round trip, every row in that column shifts down by $1.30, and the breakeven moves by just over a cent per share.
Where you see it in MetisTrades
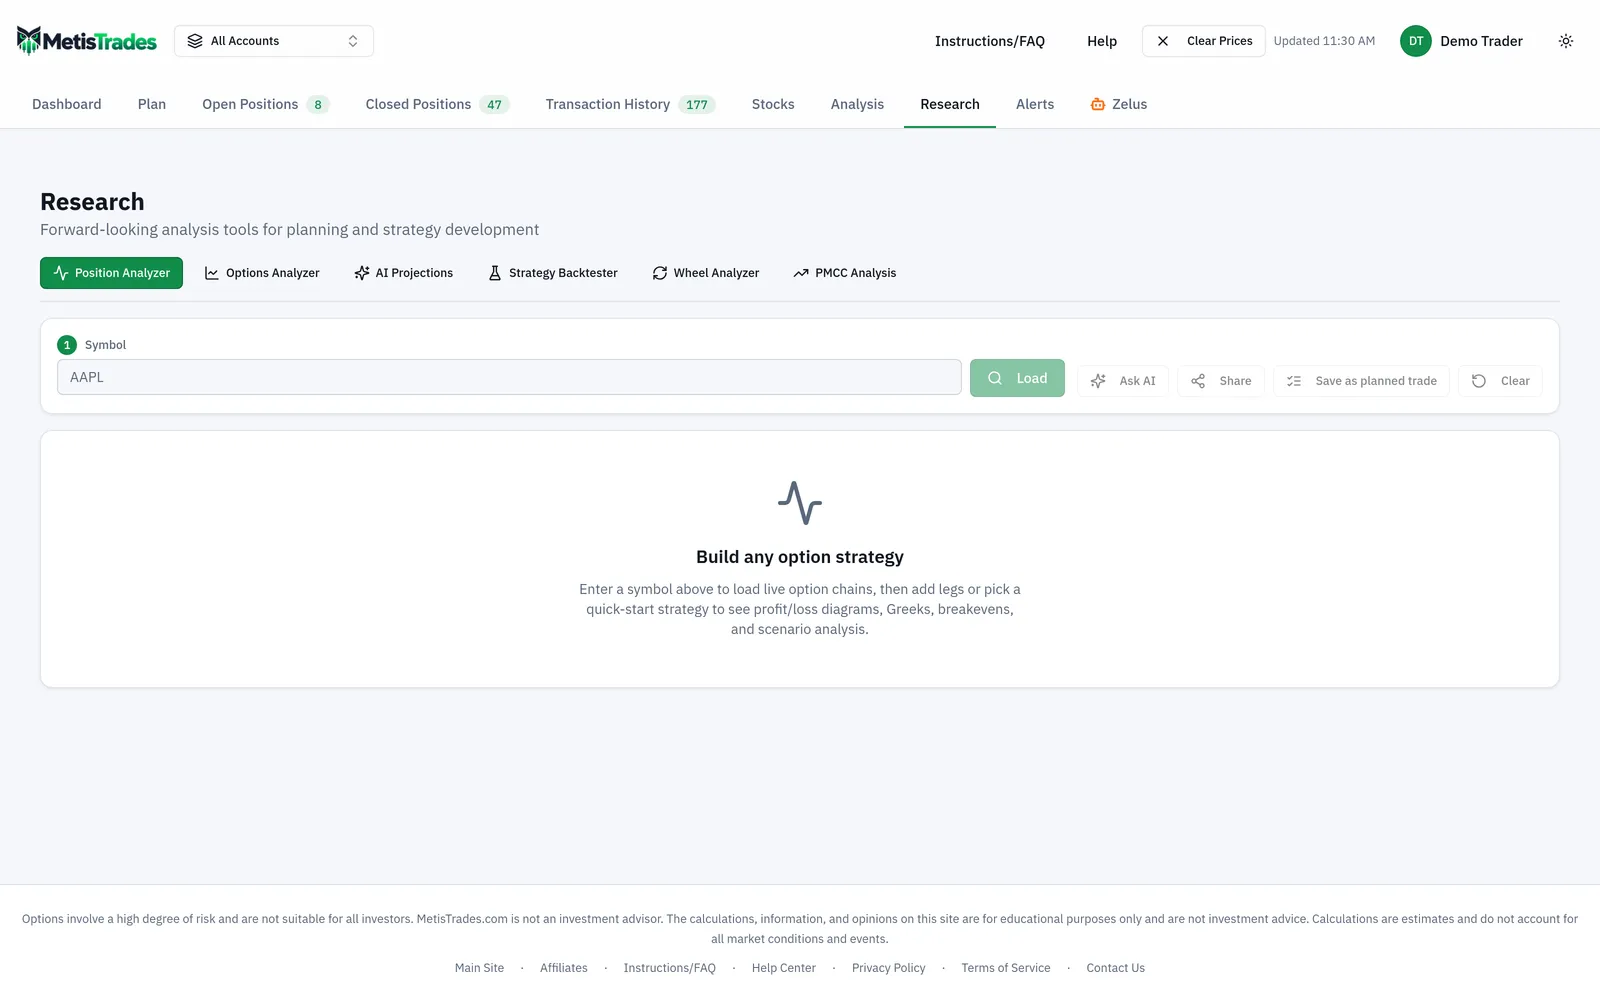
The Position Analyzer draws the same curve from legs you enter. There are two versions of it: the in-app one under Top nav → Research → Position Analyzer, and a public version at /analyzer that you can build and inspect without an account. From Open Positions, Open in Position Analyzer in the Analyze column opens a new tab with an existing position's open option legs already filled in.
You meet the symbol box first. Enter a ticker in Symbol and select Load; the page shows the Underlying price when data is available. Before that, the empty state says Build any option strategy.
Next you add the legs. Choose a quick-start strategy, or select Add leg → Option leg and set Side (Buy (long) or Sell (short)), Type (Call or Put), Expiration, Strike, Quantity, Price (per share) and IV (%). That maps directly onto the hand calculation: Sell / Put / strike 50 / quantity 1 / price 1.50 is the first column of your table. Quantity means contracts, and one contract represents 100 shares — the same ×100 you applied in Step 3. There is also a Stock (100 shares) leg if you want shares in the payoff; the combined payoff uses shares directly rather than applying the option contract multiplier.
The Price control decides which chain price is used for current leg values and new entries. Mid is the bid/ask midpoint; Natural is the ask for a long leg and the bid for a short leg, a less favourable assumption. Natural is the default. When the available spread is stale from a prior session, the page forces Mid and hides Natural.
Under Payoff at expiration you get the numbers you just computed: Net debit/credit, Breakevens, Max profit, Max loss, and Credit / width when the setup is a capped-loss credit position. Max profit reads Unlimited when upside grows without bound, which is what a lone long call would show; Max loss reads Unlimited when loss can keep growing as the underlying rises.
Then the chart itself. The solid green and red curve is At expiration — your seven rows, drawn continuously. The dashed curve is Today, or the future date you pick with Days forward, and it includes remaining time value, which is why it is rounded where the solid line has a hard bend. Spot marks the latest available underlying price and BE marks the expiration breakevens — 48.50 and 57.00 in the worked example. Look for those three elements in the image below.
Around the chart, Range widens or narrows the displayed price span from 0.5% to 250%, and IV adjustment moves implied volatility from −50 to +100 points so you can see the dashed curve shift while the solid one stays put. You can display P/L in dollars, as a percentage of maximum P/L, or as a percentage of Risk; the Risk choice is disabled when no positive maximum-risk amount can be calculated.
Selecting Table beside Graph opens the Profit / loss heatmap: rows are underlying prices and columns are dates starting with Today, with option-expiration columns emphasised. That is your pencil table extended into a second dimension — price across time rather than price alone.
The Close: controls set the horizon the modelled figures use: Expiry (the default), At DTE, or Profit target. A profit target changes the modelled exit, not the expiration structure: Max profit stays under Payoff at expiration and the page adds Profit-target exit for the capped amount.
The core builder, P/L chart, heatmap, expiration payoff facts, Delta and sharing controls are available on the public page. Probability of profit, Expected value, Tail risk (avg worst 5%), Chance of touching short strike, Return on risk / yr, Gamma, Theta, Vega and Rho, the Greek chart and heatmap modes, Auto-optimize strikes and Best close plan for these legs require Pro.
Two limits to carry with you. Quotes are delayed, so a displayed underlying price, option mark, bid, ask or IV is the latest available value and your fill can differ. And the diagram and heatmap are scenario calculations — they do not predict the underlying's future path.
Common mistakes
- Reading per-share numbers as dollars. A 1.50 premium is $150 on a standard contract. Fix: apply the contract multiplier before you compare anything to your account size.
- Assuming every contract is 100 shares. Mini options use 10 and futures options use a broker-supplied multiplier. Fix: check the multiplier on the contract, then recompute the dollar column.
- Treating the strike as the breakeven. The short 50 put breaks even at 48.50, not 50; the long 55 call at 57.00, not 55. Fix: strike minus premium for a short put, strike plus premium for a long call.
- Mistaking the dashed curve for the solid one. The dashed Today curve still contains time value, so a losing position often looks less extreme there. Fix: compare both, and use Days forward to see how the gap narrows.
- Thinking a stop shrinks max loss. Structural max loss does not shrink because you entered a stop, and gaps and slippage can produce a different fill. Fix: size the trade to the structural number under Payoff at expiration.
- Treating the visible chart range as a risk limit. An Unlimited value means the theoretical payoff is unbounded in that direction; the plotted window is just a display choice. Fix: widen Range and read the payoff facts rather than the chart edges.
- Reading probability figures as outcomes. Probability of profit, expected value and tail risk come from current IV, time and a lognormal price model. Fix: treat them as model estimates and weigh them against max loss, premium and liquidity.
Related guides and help pages
Related guides
- Calls and Puts: What an Option Contract Actually Is
- The Greeks in practice: delta, theta, vega and gamma
- Vertical spreads: defined-risk option trades
- Building and Stress-Testing a Trade in the Position Analyzer
- Plan, Track, Optimize: a complete tour of MetisTrades
- Short put deep in the money with a week left: assign, roll, or close?