Reading one symbol in depth: the Options Analyzer deep dive
The Options Analyzer deep dive expands one watchlist symbol into an end-of-day review of momentum, volatility, positioning and contract activity. Here is how to work through it in order, and how to read each panel honestly.
What it does and when to use it
The Options Analyzer screener gives you one row per watchlist symbol. The symbol deep dive expands that row into a detailed end-of-day review of a single ticker: momentum and trend history, historical reliability checks, term structure, strike positioning, volatility history, open-interest changes, unusual activity, and the current stored chain.
It answers one question: what do the end-of-day option statistics for this symbol currently look like, and how have similar readings behaved in the past? It does not answer "should I trade this". The page is descriptive. Its scores, historical hit rates and positioning measures are not predictions, guarantees, trading signals or investment advice.
A few terms the page leans on, in plain words:
- Open interest (OI) — the total number of contracts currently open at a given strike and expiration. It is not the number traded today, and it is published with a lag.
- Volume — contracts traded today for a specific contract. Volume alone does not tell you whether buyers or sellers were the aggressors.
- Implied volatility (IV) — the level of future movement implied by an option's price. High IV means a wider priced range, not a direction.
- IV Rank 52w — where current at-the-money IV sits between its 52-week low and high, from 0 to 100.
- VRP — volatility risk premium: ATM implied volatility minus annualised 20-day realised volatility, stated in volatility points.
- Max pain — the strike at which the greatest amount of option value would expire worthless.
- Momentum flip — a smoothed turn in the momentum composite, identified by a zero-line cross or a fast/slow average crossover.
Use it when you already have a symbol in mind and want context before you build or adjust a position: how stretched is IV against recent realised movement, where is open interest piled up, has activity in a particular strike jumped. Access depends on the symbol: some watchlist symbols are open to everyone, including anonymous visitors, while paid-tier watchlist symbols require Pro. A visitor without access sees The SYMBOL deep-dive is a Pro feature with Start free trial or Upgrade to Pro and Back to screener.
A worked scenario
You hold no position in XYZ yet. It has drifted up over the past week and you are considering selling a covered call or a cash-secured put, so you want to know whether option prices look rich, where the crowd is positioned, and whether anything unusual traded yesterday.
You open the deep dive and read the header first: XYZ, latest stored underlying price 182.40, 5d change +3.6%, and As of the previous trading day's snapshot. An Earnings badge shows the next report in 31 days, with Last EPS beat from the prior quarter.
Here is what the main panels show on that snapshot date:
| Panel | Reading |
|---|---|
| Momentum (Standard, As of) | Composite +41, with its nine signal badges |
| Momentum (Standard, 3d average) | +34, window states 3 of 3 trading days available |
| Multi-horizon trend | Short +44 bullish, medium +28 bullish, long −9 bearish; verdict Divergent |
| Flip Accuracy (20-day forward) | 14 graded flips, 9 moved as called, average favourable move 4.2%; 2 pending, 1 skipped |
| Positioning Setup | +22, bullish setup tag |
| Term-Structure Sentiment | Next week +18, 7–30d +26, 30–60d +9, longer-dated −12; summary Mixed |
| Strike Positioning (nearest expirations) | Call wall 190, put wall 175, max pain 180, Est. gamma flip 178.50, Est. net GEX positive |
| Snapshot Metrics | P/C Volume 0.72, P/C OI 1.05, IV Rank 52w 36, Term Slope mildly positive, VRP tile 7.4 |
The arithmetic behind three of those numbers, so you can check them by hand:
- P/C Volume = put volume ÷ call volume = 18,400 ÷ 25,600 = 0.71875, shown as 0.72. Call-heavy for the day.
- IV Rank 52w = (current ATM IV − 52-week low) ÷ (52-week high − 52-week low) = (34.2 − 21.0) ÷ (58.0 − 21.0) = 13.2 ÷ 37.0 = 0.357, shown as 36.
- VRP = ATM IV − 20-day realised volatility = 34.2 − 26.8 = 7.4 volatility points.
In Today's Unusual Activity, one line stands out: the 190 call in the 7–30 day window with Today Vol 4,120 against OI 1,350, so V/OI = 4,120 ÷ 1,350 = 3.05. Its Peer %ile is 97, OI Δ is +780 versus the prior day, IV 36.8 and Δ 0.24. The rest of the guide follows this XYZ snapshot.
Step by step in MetisTrades
1. Open the deep dive
- Go to Top nav → Research → Options Analyzer and select an unlocked symbol from the screener. The direct route is
/research/options-analyzer/SYMBOL. - You can also arrive by selecting a contract in the screener's Contract leaderboard. In that case, the matching contract-history dialog opens with the symbol behind it.
- Use Screener at the top of the page whenever you want to go back to the Options Analyzer list.
2. Fix the date before reading anything
Read the header: ticker, company name when available, latest stored underlying price, 5d change, and As of the snapshot date. Treat the As of date as the controlling date for every panel below it. For XYZ that date is the previous trading day, so nothing on the page reflects today's session.
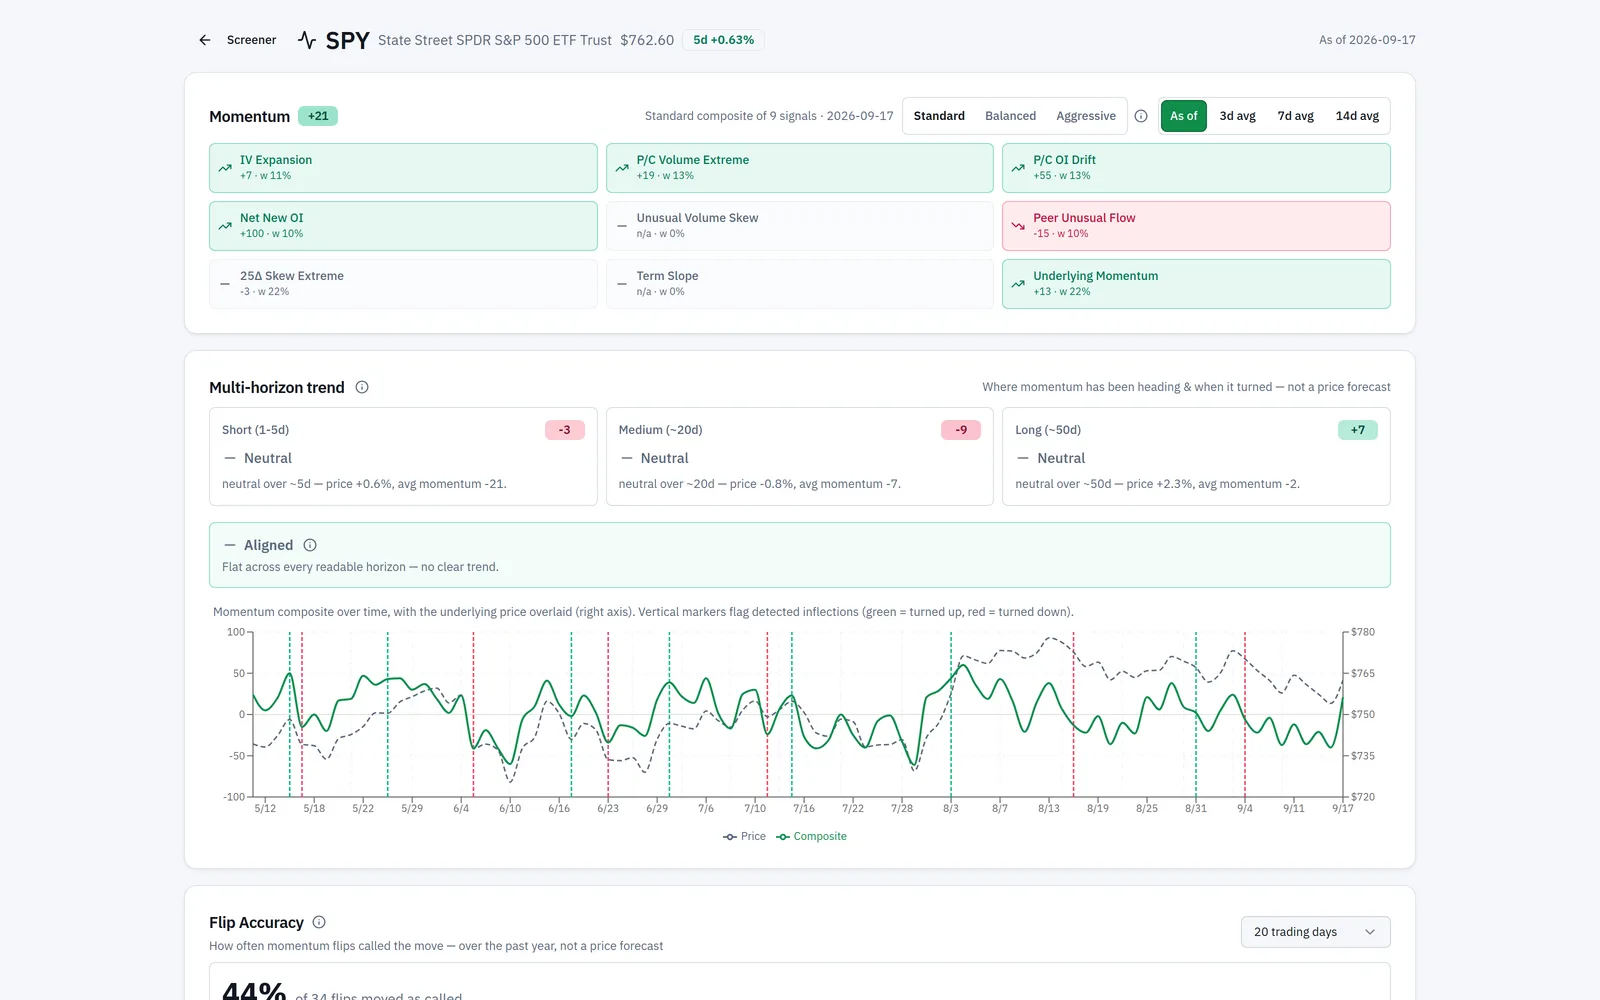
The screenshot below is the whole deep dive in one view. Look at the ordering: header and date first, then momentum and trend, then the positioning and volatility panels, then contract-level tables at the bottom.
3. Read Momentum and Multi-horizon trend
The Momentum header identifies the active mode — Standard, Balanced or Aggressive — and the composite with its nine signal badges. Switch the averaging control between As of, 3d, 7d and 14d. The as-of view uses one snapshot date; an averaged view states the window and how many trading days were actually available. If there is no momentum record, the page says it needs at least five prior days of summary data.
Multi-horizon trend then compares short-, medium- and long-horizon momentum. Each tile shows a score, a bullish, bearish or neutral direction, and an explanation; a partial badge means the window did not have its full intended history. The verdict is Aligned, Divergent, Mixed or Insufficient. The chart plots the composite over time with underlying price on a separate axis when available, and green and red vertical markers identify detected turns.
4. Check Flip Accuracy before you trust the momentum read
Flip Accuracy checks detected momentum flips against later underlying closes over roughly the past year. The default forward horizon is 20 trading days and is remembered in your browser; you can also choose a flip-to-flip run or another displayed forward window. The panel reports how many flips moved as called, the average favourable move, separate Bullish flips (turned up) and Bearish flips (turned down) results, and small-sample warnings. Pending flips do not yet have enough future data; skipped flips lacked the needed daily price. Mode comparison shows the same historical results for Standard, Balanced and Aggressive.
5. Work through positioning
Positioning Setup is marked Leading. Its −100 to +100 score uses positioning inputs while leaving slower price and IV-trend inputs out, and a bullish or bearish setup tag marks divergence between price and positioning. The panel shows its measured history against confirmed flips and actual price moves, and states that it remains an early, unconfirmed pattern.
Term-Structure Sentiment splits positioning into expiration windows — the next week, 7–30 days, 30–60 days and longer-dated contracts — combining skew relative to that symbol and bucket's own history, open-interest changes by side, and delta-weighted volume. It can summarise the clear windows as Broadly Bullish, Broadly Bearish or Mixed; Mixed requires clear windows pointing in opposite directions. Its accuracy section grades the chosen read against later close-to-close moves over the past year, with a Forward window control.
Strike Positioning can combine the nearest expirations or focus on one expiration from the selector. It reports Call wall, Put wall, Max pain (or Max pain (front)), Est. gamma flip and Est. net GEX. The chart plots call gamma times open interest above zero and put gamma times open interest below zero, with reference lines for spot, the walls and the estimated flip when they fall inside the displayed strike range.
6. Read volatility and activity history
Snapshot Metrics shows P/C Volume, P/C OI, IV Rank 52w and Term Slope, with the same As of, 3d, 7d and 14d averaging. A separate VRP tile appears when that reading exists and shows its percentile in the symbol's own recent history.
Below that, ATM IV Trend plots roughly 30-day ATM IV with 30-day and 90-day moving averages; its VIX control adds or removes VIX on the right axis, and the panel can also show VIX rank, 60-day IV/VIX correlation, and an expanding or compressing IV badge. Volatility Risk Premium Trend plots ATM IV minus 20-day realised volatility. Put / Call Ratio History plots daily P/C volume and P/C open interest, with higher readings more put-heavy. Volume & Open Interest uses stacked call and put volume bars with separate call and put open-interest lines. Known earnings dates are marked on these charts. The history cards offer 180d, 90d and 30d ranges, with 90d selected initially, and say so when there are fewer than 20 snapshot days.
7. Drop down to contracts
Top contracts ranks contracts for the symbol with Income and Directional intent controls. OI Delta Movers (vs prior day) highlights the largest open-interest changes, with All, Calls or Puts filtering, sortable columns and contract history. Today's Unusual Activity ranks contract-level activity using Today Vol, OI, V/OI, Peer %ile, OI Δ, IV and Δ; its Show new strikes control includes contracts absent from the prior snapshot, marking their OI change as new rather than assuming the baseline was zero. Current Chain is collapsed initially and offers All, Calls and Puts filtering with sortable columns for expiration, strike, type, bid, ask, volume, open interest, IV and Greeks. Select two contracts with the same expiration and use Compare strikes; contract history can plot price, IV, Greeks, OI, volume, underlying close and VIX.
How to read the results
Start with what XYZ's numbers mean on their own terms.
Momentum +41 with a Divergent verdict. Short and medium horizons agree that recent momentum has turned up; the long horizon has not. Divergent means exactly that and nothing more — it does not say which horizon wins. The 3d average of +34 being below the As of value of +41 tells you the latest day was the strongest of the three, not that the trend is accelerating in any durable sense.
Flip Accuracy 9 of 14 at 20 days. That is 64.3% of graded flips moving in the called direction, with an average favourable move of 4.2%. Read it as a description of 14 past observations at one chosen horizon. Change the forward window and the number changes. Fourteen is a small sample, and the panel's small-sample warnings exist for that reason. It says nothing about the next flip.
IV Rank 52w of 36 with VRP of 7.4. Current ATM IV of 34.2 sits just over a third of the way between the 52-week low of 21.0 and high of 58.0 — middling, not elevated. But implied is running 7.4 volatility points above 20-day realised, so options have been priced for more movement than the stock has delivered recently. Those are two different statements: one is about IV versus its own history, the other about IV versus actual movement. The VRP tile's percentile tells you whether 7.4 is wide or narrow by XYZ's own recent standard.
Term-Structure Sentiment: Mixed. The next week at +18 and 7–30 days at +26 read bullish, while longer-dated reads −12. Mixed is the summary because clear windows point in opposite directions. It is a descriptive read of skew, open-interest changes by side and delta-weighted volume within each bucket, judged against that symbol and bucket's own history — not a forecast for any of those windows.
Strike Positioning: call wall 190, put wall 175, max pain 180, Est. gamma flip 178.50. With spot at 182.40, the largest call open interest sits about 4% above and the largest put open interest about 4% below. These are concentrations of existing contracts, nothing more. Price is not required to stop, reverse or settle at any of them. Est. net GEX being positive reflects an assumed dealer-hedging convention; it is an estimate, not observed dealer inventory.
The 190 call with V/OI of 3.05 and Peer %ile 97. Yesterday's volume was about three times the contract's existing open interest, and that volume was high relative to comparable contracts. The OI Δ of +780 says open interest grew. What none of it tells you is who traded or why: open interest is published with a lag and cannot by itself show whether a trade opened or closed a position, was bought or sold, or expressed a bullish or bearish view. A +780 change is consistent with new call buyers and equally consistent with new call sellers.
Read together, XYZ's snapshot is a symbol with upward short-term momentum, a Divergent longer horizon, mid-range IV that is nonetheless pricing more movement than has been realised, call-heavy day volume, and a burst of activity at the 190 strike where call open interest is already concentrated — with earnings 31 days out, which sits inside the 30–60 day bucket. That is a description of a state, not a trade idea.
Limits and assumptions
All option-chain data on this page is end-of-day, never intraday. Midpoints and underlying closes can be stale by the next market open and may differ from executable prices. The scheduled snapshot sweep begins at 5:00 p.m. Eastern on trading weekdays, skips weekends and exchange holidays, and processing or administrative controls can delay or pause an update. Always check the As of date first.
Momentum, Positioning Setup, Multi-horizon trend, term sentiment, unusual-activity measures and contract scores are descriptive statistics, not predictions or advice. Historical hit rates are sensitive to the selected forward window, the number of available observations and missing price data; they do not establish future reliability.
Call walls, put walls, max pain and gamma concentrations are positioning heuristics. Est. gamma flip and Est. net GEX assume a dealer convention and are rough estimates rather than observed positioning. Open interest arrives with a lag and carries no information about intent or direction on its own.
Several panels need history to exist. Momentum needs at least five prior days of summary data; several history charts need at least 20 snapshot days and will say so when they do not have them. Earnings dates and report details can be absent, and when they are, the page hides or omits that context rather than estimating it. Unavailable inputs are excluded and active ones reweighted rather than guessed at.
Some panels are not shown to regular viewers at all. Positioning Snapshot is admin-only, as are predictive horizon outlook leans, probabilities, ranks, contributors, model accuracy and model internals, along with the Export JSON control. If you are looking for a forecast lean on this page, there is not one.
Finally, no panel accounts for your objectives, portfolio, buying power, taxes or suitability. Verify the current chain and the market before trading.
Common mistakes
- Treating the page as today's flow. Everything comes from end-of-day snapshots — read the As of date before you interpret a single panel.
- Reading a 64% flip accuracy as a 64% chance the next flip works. It describes 14 past flips at one forward window; change the window or the mode and the figure moves.
- Assuming price must respect the call wall, put wall or max pain. These are concentrations of open contracts, not barriers; treat 190, 175 and 180 as context, not levels.
- Reading an OI Δ of +780 as bullish buying. Open interest cannot tell you whether a trade opened or closed, or whether it was bought or sold — pair it with the rest of the panel and leave intent unassigned.
- Confusing IV Rank with VRP. IV Rank 36 compares IV with its own 52-week range; VRP of 7.4 compares IV with realised movement. Quote whichever one your decision actually depends on.
- Comparing an averaged momentum value with an as-of term-structure read. Set As of, 3d, 7d or 14d consistently across the panels that offer the control, and check how many trading days were actually available.
- Trading straight from the Current Chain's stored bid and ask. They are end-of-day values; confirm the live market at your broker before placing an order.
Related guides and help pages
Related guides
- Implied Volatility: What Option Prices Say About Movement
- Plan, Track, Optimize: a complete tour of MetisTrades
- Building and Stress-Testing a Trade in the Position Analyzer
- Screening a Watchlist with the Options Analyzer
- Backtesting an Options Strategy with the Strategy Backtester
- Replaying one options trade with Trade Backtest