Keeping a Watchlist of Planned Trades
How to record entry ideas with a trigger price and the collateral each one needs, check them against your buying power, and act only when conditions are met — by hand in a spreadsheet, then in MetisTrades.

What it is and why it matters
A planned-trade watchlist is a written list of trades you intend to open but have not opened yet. Each row says what the trade is, at what underlying price you want to act, and how much cash or buying power it would tie up if it filled.
That last part is the one most traders skip. It is easy to carry four or five "I'd sell a put on that if it pulled back" ideas in your head. It is much harder to notice that if three of them triggered in the same week, you would need more collateral than the account has. Collateral here means the cash a position ties up: for a cash-secured put — a short put backed by enough cash to buy the shares if assigned — it is the strike multiplied by the contract size multiplied by the number of contracts.
Writing ideas down does three things that memory does not.
- It fixes the entry level before the market moves. If you decide in advance that you want XYZ at 47 or below, you are less likely to talk yourself into 49 on a green day.
- It makes the total commitment visible. One idea at a time always looks affordable. The sum of the list is the number that matters.
- It creates a record. Later you can see which ideas you acted on, which never triggered, and which you let go stale — useful information about your own behaviour.
A watchlist is not an order and it is not a forecast. Nothing about writing a trade down makes it more likely to work out. Selling puts and calls carries real risk, including assignment and loss, and a plan only controls the part you can control: the price you are willing to act at, and the size you are willing to commit.
Two definitions you will need throughout. An entry trigger is the underlying price at which you want to act. A direction says which side of that price counts: "at or below" for ideas you want on a pullback, "at or above" for ideas you want after a move up — a covered call you only want to write once the stock has run, for instance.
How to track it by hand
One row per idea. Six columns you type, four the sheet works out for you. Here is the worked example with three ideas on the list.
The columns
- Symbol, Idea — the ticker and a one-line description of the structure you have in mind.
- Direction — "at or below" or "at or above".
- Entry trigger — the underlying price you want to act at.
- Last price — the most recent underlying price you have. You type this in, and it is only as fresh as the last time you updated it.
- Strike and Contracts — the planned option strike and size. Leave these at 0 for ideas where no cash collateral applies.
- Trigger met? (computed) — Yes or No.
- Distance to trigger (computed) — how far the price has to travel, as a percentage of the last price.
- Collateral needed (computed) — strike × 100 × contracts.
| Symbol | Idea | Direction | Entry trigger | Last price | Strike | Contracts | Trigger met? | Distance to trigger | Collateral needed |
|---|---|---|---|---|---|---|---|---|---|
| XYZ | Sell 45 put on a pullback | at or below | 47 | 49.2 | 45 | 1 | No | -0.044715 | 4500 |
| ABC | Sell 28 put at support | at or below | 30 | 29.6 | 28 | 2 | Yes | 0.013514 | 5600 |
| DEF | Covered call after a leg up | at or above | 62 | 58 | 0 | 0 | No | 0.068966 | 0 |
| Total | Collateral if all puts fill | 10100 |
Walking the rows
XYZ. You want to sell the 45 put, but only if the stock pulls back to 47 or lower. It last printed 49.2, which is above 47, so the "at or below" test fails and Trigger met? reads No. The distance is (47 − 49.2) ÷ 49.2 = −2.2 ÷ 49.2 = −0.044715, or −4.47%. The minus sign tells you the stock has to fall 4.47% to reach your level. The collateral is 45 × 100 × 1 = 4,500.
ABC. Entry trigger 30, last price 29.6. For an "at or below" idea, 29.6 ≤ 30, so the test passes and Trigger met? reads Yes. The distance arithmetic still runs: (30 − 29.6) ÷ 29.6 = 0.4 ÷ 29.6 = 0.013514, or 1.35%. Because the trigger is already met, read that as 1.35% past your level rather than 1.35% to go. Two contracts of the 28 put need 28 × 100 × 2 = 5,600 in collateral.
DEF. This one is the other direction. You own the shares and want to write a covered call, but only after a leg up to 62 or better. Last price 58, which is below 62, so the "at or above" test fails: No. Distance is (62 − 58) ÷ 58 = 4 ÷ 58 = 0.068966, or 6.90% — the stock needs to rise that much. Strike and contracts are 0 because a call written against shares you already own does not tie up cash collateral in the same way, so the collateral column returns 0.
The total. Add the collateral column: 4,500 + 5,600 + 0 = 10,100. That is the figure to hold against the cash and buying power in the account. If the account has 9,000 available, you have a list that cannot all fill, and you should decide now which idea you would drop rather than in the moment.
The formulas
With columns A–J as above and {r} as the row number:
- Trigger met? —
=IF(A{r}="","",IF(C{r}="at or below",IF(N(E{r})<=N(D{r}),"Yes","No"),IF(N(E{r})>=N(D{r}),"Yes","No"))) - Distance to trigger —
=IF(A{r}="","",IF(N(E{r})=0,"",(N(D{r})-N(E{r}))/N(E{r}))) - Collateral needed —
=IF(A{r}="","",N(F{r})*100*N(G{r}))
The N() wrapper turns a blank or a stray text entry into zero so a half-filled row does not throw an error, and the leading IF(A{r}="","") keeps empty rows quiet. Format the distance column as a percentage. The spreadsheet below already contains these three ideas and the formulas.
Download the template: Planned trades watchlist (.xlsx). It opens in Excel, and in Google Sheets via File → Import. The worked example from this guide is already filled in, and the formulas carry down into the blank rows.
The discipline is simple: update the Last price column, scan the Trigger met? column, and check the total before you place anything. Note that the collateral formula assumes 100 shares per contract. Mini options use 10 and futures options use a broker-supplied multiplier, so if you trade those, change the 100.
Where manual tracking breaks down
The sheet works. It stops working for reasons that have nothing to do with the arithmetic.
The prices go stale and nobody notices. Every row depends on the Last price you typed. If you updated the sheet on Monday and look at it on Thursday, three "No" rows might have been "Yes" on Tuesday and back again. The sheet cannot tell you the difference between a level that was never reached and a level you missed because you did not open the file.
Collateral is only modelled for one shape. Strike × 100 × contracts is right for a cash-secured put. It is wrong for a vertical spread, where the requirement is roughly the width of the strikes, wrong for a naked call, and wrong for anything with a stock leg. The moment your list has mixed structures, the total at the bottom is understating or overstating the commitment and you have to patch each row by hand.
The buying-power side is a number in your head. The sheet totals what the ideas would take. It has no idea what the account has. Comparing the two means opening the broker, reading a figure, and remembering it — and if you trade in two accounts, deciding which idea belongs to which pool.
Executed ideas linger. You sell the ABC puts on Tuesday. Unless you go back and mark the row, ABC is still sitting on the list counting 5,600 toward your total commitment, which is now a position, not a plan. Double-counting in that direction makes you feel over-committed; forgetting to remove an idea you abandoned does the opposite.
Ideas with a shelf life never expire. "Sell this before earnings" is an idea with an end date. A spreadsheet row has no end date, so three months later you are scanning past a trigger that stopped being relevant in July.
Partial fills and size changes. You planned 2 contracts and got 1. The row says 5,600. The reality is 2,800 committed and possibly 2,800 still wanted. Keeping that straight across several symbols by hand is exactly the kind of small bookkeeping that quietly stops happening.
Corrections are manual everywhere. Change a strike and you have to remember the collateral cell, the total, and anything downstream that referenced it. One sheet is fine. One sheet maintained for eleven months across two accounts is where rows go missing.
How MetisTrades does it
MetisTrades keeps the same list as a page called Planned Trades, under Plan in the top navigation (/plan/planned-trades). A planned trade there is not an order; nothing on the page sends anything to your broker.
The Plan area needs a signed-in account with active subscription or lifetime access, so Planned Trades is Pro-gated as well as requiring an account. Anonymous visitors who open Plan see Sign In Required instead of the content.
Adding an idea
The Planned trades card starts with a Planned trade button, which opens the New planned trade dialog. The main fields are Symbol, Strategy, Account (including All accounts), Planned size, Buying power override ($), Draft legs (optional), Entry conditions and Notes.
Choosing a supported strategy on a new, empty trade can pre-fill its leg structure, and you can add Option or Stock legs by hand. An option leg takes Side (Buy to open or Sell to open), Type, Expiration, Strike, Qty, Premium / share and Multiplier — the multiplier being shares per contract, which is where the "not always 100" problem from the spreadsheet gets handled properly. Where chain data is available, the strike picker shows searchable rows with Strike, Bid / Ask, Mid and Δ, marks the nearest strike ATM, and fills Premium / share from the mid when you select one. If no chain is available, the form says Chain unavailable — enter the strike. and you type it.
The form previews Estimated buying power when it can price the shape. When it cannot, it says No buying-power estimate for this shape yet — pick a supported strategy with matching legs, or enter an override. That is the replacement for the strike × 100 × contracts column: supported shapes are estimated, and anything else you cover with Buying power override ($), which is your own input rather than a broker-confirmed requirement.
Entry conditions
Under Entry conditions, set Underlying price to at or below or at or above and enter Price ($) — the same two fields as the Direction and Entry trigger columns in the sheet. When a latest available price is present, the form offers use followed by that price.
You can also save Minimum credit (note), Window from and Window to. The credit is a reminder and is not checked against option prices. The date window is also a reminder: it pauses the entry alert outside its dates, and once Window to has passed the trade is archived automatically on the first US Eastern day after that date. A window ending Sep 25 stays on the watchlist all of Sep 25 and moves to archived on Sep 26, with the row noting Archived automatically — window ended. That is the shelf-life problem handled without you remembering.
The watchlist
The table columns are Trade, Entry when, Underlying, Size, Est. BP, Fit, Alert and Actions. Above it, the summary shows Available buying power for the current account scope with a source label, If every watched trade opened, and a count of trades without an estimate. Look at the relationship between those two summary figures and then at the Fit column on each row.
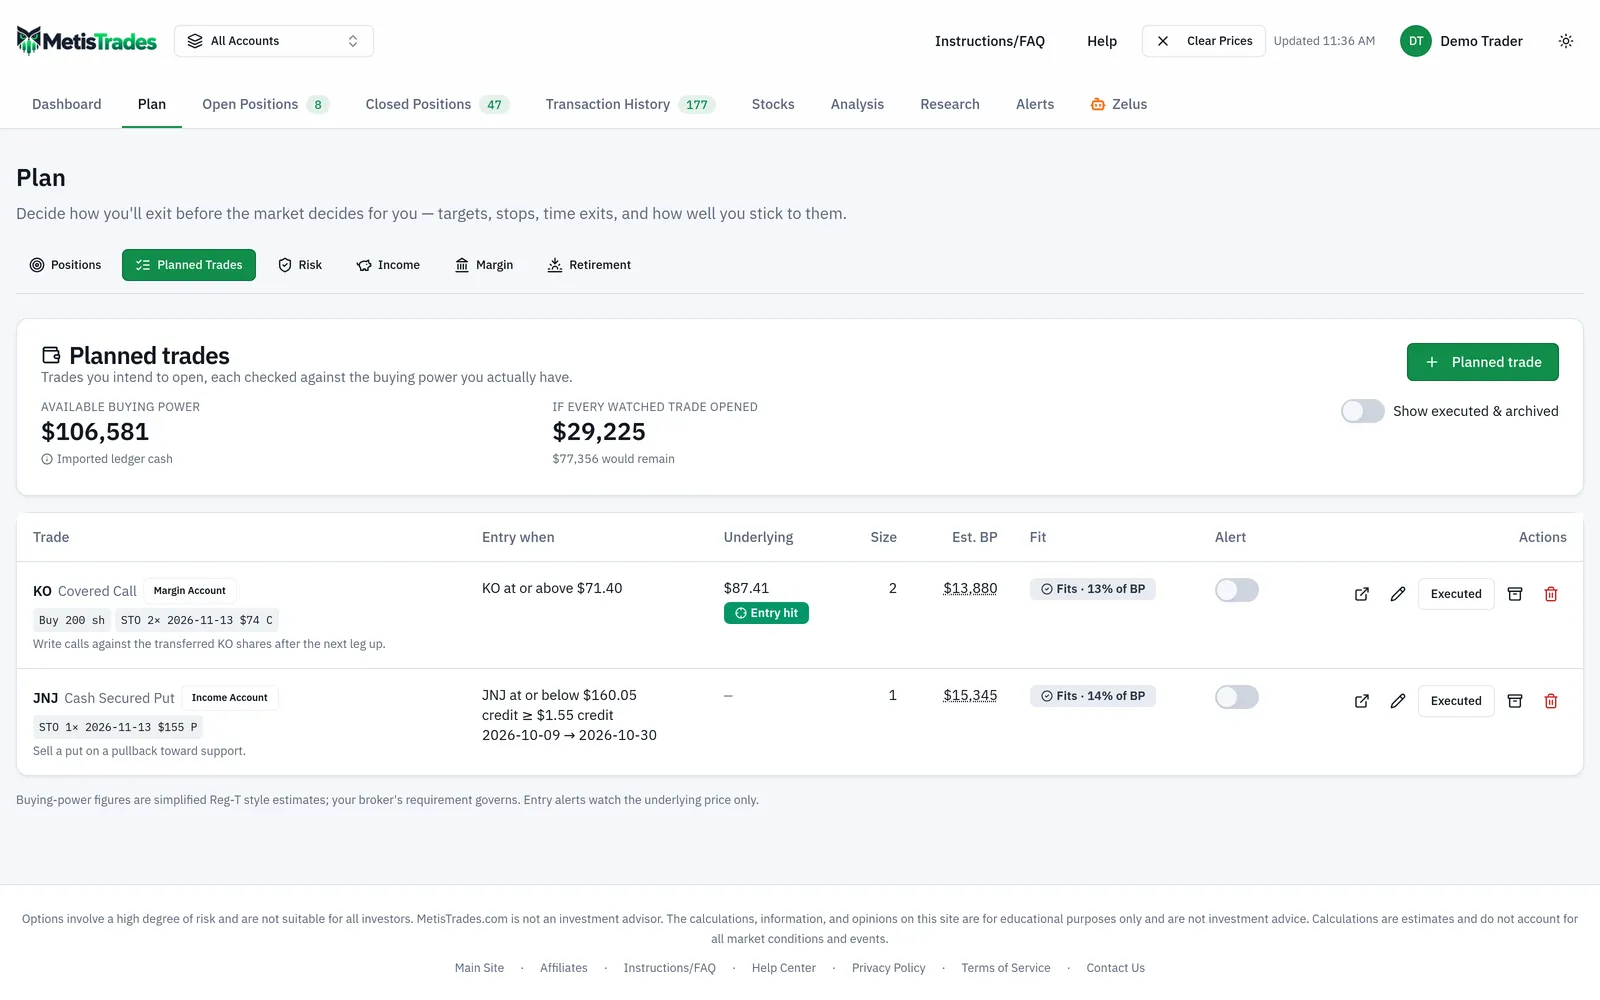
The Underlying column shows the latest available delayed quote after prices have been requested. For a watching trade with an underlying-price condition it reads Entry hit when the condition is satisfied, Near when the level is within 2%, or the percentage to level when it is farther away — the same information as the Trigger met? and Distance to trigger columns, computed from a quote you did not have to type in.
Alerts, sizing and recording the fill
Only an Underlying price condition can be armed. Without one, the Entry alert switch is disabled and explains Set an underlying price condition to enable an entry alert. Arming also needs alert access: an active subscription plus the site Alerts feature flag, which is currently in testing; while the flag is off the switch is refused with Alerts feature is currently in testing. After an alert fires it is no longer armed, and the switch explains Triggered — flip on to re-arm.
Below the legs, a Sizing panel sizes the draft against your own closed-trade history for that strategy, showing closed trades, win rate, average win and loss, expectancy, profit factor, and Full, Half and Quarter Kelly rows with the contract counts they imply. It needs at least 30 closed trades for the strategy before it will estimate an edge, and it is a Pro feature; without Pro access the panel shows Kelly sizing and drawdown odds are a Pro feature.
When you open the trade, select Executed. The Mark symbol as executed dialog explains that the app suggests likely fills but never marks a plan executed on its own; under Resulting position you pick a matching open position or Don't link a position, then select Mark executed. When one of your open positions looks like the fill of a watched plan, the row carries a Looks executed badge naming that position, with Confirm and Not this one buttons. A different contract count does not block the suggestion — the badge notes it, for example 3 of 5 planned contracts, which is the partial-fill case the spreadsheet handled badly. Archive removes an unexecuted idea from the active list; Show executed & archived brings closed rows back into view, and Restore to watching undoes either.
How to read the results
Available buying power is the amount available for the current account scope, with a source label such as Broker buying power, Broker cash balance, Imported ledger cash, or Broker + ledger (mixed). Read the label, not just the number. The app prefers broker-reported buying power, then broker cash, then cash reconstructed from imported transactions — and cash rebuilt from imported transactions is an estimate that missing transactions, transfers or account assignment can shift.
If every watched trade opened is the sum of every available Est. BP value for trades still on the watchlist, followed by how much would remain or Over available by an amount. It is the 10,100 line from the spreadsheet. Trades with no estimate are omitted from that sum and counted separately as without an estimate, so if that count is not zero, the total understates your commitment by however much those rows would take.
Est. BP is either the Buying power override ($) you typed or a simplified estimate based on the strategy and draft legs. These are simplified Reg-T-style estimates; your broker's requirement governs, and an override is your own figure rather than a broker-confirmed one.
Fit compares one trade's Est. BP with the full Available buying power for the current scope: Fits · _% of BP is the share that single trade would use, Over by is the shortfall, and No estimate means the shape could not be priced. Fit is a per-trade measure. Three trades that each say "Fits · 40% of BP" do not all fit together; that is what the summary line is for.
Entry hit means the latest available underlying quote is at or beyond your saved condition. Near means it is within 2%. What neither means is that the level was reached at a moment you could have acted on. Quotes are delayed, and the page does not continuously watch every price movement; a missing quote cannot produce an Entry hit or Near signal at all. Treat these as "go and look", not "this filled".
Minimum credit (note) is a text reminder only and is never checked against option prices. If the entry level is hit but the premium is not there, that is on you to see on the chain.
Watching, Executed and Archived are the three states. A Looks executed badge is a suggestion only — the trade stays Watching, and keeps counting toward the commitment total, until you confirm it in the dialog. Suggestions cover option legs only, require an exact leg match, ignore closed positions, and never change a trade's status by themselves.
Finally, the Sizing panel's figures are estimates from your own past trades, not advice. Kelly assumes independent trades of a similar shape to the history, and past results do not set future ones.
Common mistakes
- Reading the summary total as a safety check. Trades counted as without an estimate are left out of If every watched trade opened. Fix: give every row either draft legs for a supported strategy or a Buying power override ($).
- Assuming 100 shares per contract. The spreadsheet's collateral formula hard-codes 100, and mini options use 10 while futures options use a broker-supplied multiplier. Fix: edit the 100 in the sheet, and set Multiplier on the option leg in the app.
- Treating an entry signal as a fill. Quotes are delayed and the page does not watch every price movement. Fix: use Entry hit and Near as a prompt to check the live market at your broker before acting.
- Leaving executed ideas on the watchlist. A filled trade that still says Watching keeps inflating your committed total. Fix: select Executed on the row, or Confirm the Looks executed suggestion.
- Expecting the minimum-credit note to stop you. It is a reminder and is not monitored. Fix: check the credit yourself on the chain when the level is reached.
- Arming an alert without a price condition. The switch stays disabled, and the credit note and date window cannot arm it. Fix: edit the trade and add an Underlying price condition.
- Forgetting that a triggered alert disarms itself. After it fires, the switch is off and says Triggered — flip on to re-arm. Fix: turn it on again if you still want that level watched.
Related guides and help pages
Related guides
- Replaying one options trade with Trade Backtest
- Plan, Track, Optimize: a complete tour of MetisTrades
- Planning Your Portfolio: A Tour of the Plan Tab
- Exit plans: deciding how you will leave a trade
- Setting and Tracking an Options Income Goal
- Planning a Margin Paydown: Setting a Destination LTV and Tracking Progress