The poor man's covered call, and how to evaluate one
A poor man's covered call swaps 100 shares for a deep in-the-money LEAP call. This guide works through one XYZ setup by hand, then uses PMCC Analysis to project short-call income, payback and risk across four price scenarios.

What it does and when to use it
A poor man's covered call (PMCC) replaces the 100 shares in a covered call with a deep in-the-money, long-dated call, then sells shorter-dated calls against it. The long call costs a debit (money paid out) and gives stock-like exposure; the short calls may collect credits (money taken in) over repeated cycles. It is not literally covered by stock, and its risks differ from a covered call.
Some terms this relies on:
- LEAP — the long-dated call used as the long side of the strategy. In PMCC Analysis, long-call expirations must have at least 180 DTE (days to expiration).
- Delta — roughly how much an option's value moves for a $1 move in the underlying. A 0.80-delta call behaves somewhat like 80 shares.
- Intrinsic value — the in-the-money amount of the call, multiplied by 100 shares. Extrinsic (time) value is whatever the premium is above that, and it decays toward zero by expiration.
The question PMCC Analysis answers is narrow and useful: if I buy this particular long call and sell calls at this target delta every few weeks, how much of the debit would projected short-call income recover, and what does the modelled profit or loss look like if the stock ends up higher, flat or lower? It is for someone comparing candidate long calls and short-call settings before committing, or sanity-checking a PMCC they already hold.
PMCC Analysis is pro-flagged: you need Pro access and the site research/backtesting feature flag. An anonymous visitor sees Sign In Required, with a Sign In button and a Start Free Trial link. A signed-in visitor without active access sees Subscription Required and View Account & Upgrade.
A worked scenario
XYZ is trading at $100.00 on the latest available price. You want stock-like exposure without paying $10,000 for 100 shares, so you look at a call expiring in 420 days with a $75 strike.
| Input | Value |
|---|---|
| Underlying price | $100.00 |
| LEAP expiration | 420 DTE |
| LEAP strike | $75 |
| LEAP premium (debit) | $2,850 |
| LEAP delta | 0.82 |
| Short call expiration | 35 DTE |
| Target Delta | 0.30 |
| Selected short strike | $107, delta 0.31 |
| Credit (per contract) | $145 |
Work the pieces by hand first. The LEAP's intrinsic value is ($100.00 − $75) × 100 = $2,500. You paid $2,850, so extrinsic value is $2,850 − $2,500 = $350, about 12% of the premium. That $350 is the part guaranteed to disappear if you hold to expiration, so it is the first thing short-call income has to cover.
At $145 a cycle, $350 ÷ $145 = 2.41, so three completed cycles ($435) cover the initial time value. Covering the entire $2,850 debit would take $2,850 ÷ $145 = 19.7 cycles. Twelve 35-day cycles fit inside 420 days, and 12 × $145 = $1,740, or 61% of the debit. Before you touch the app you already know two things: the time value is recovered early, and the full debit is not recovered by premium alone within the LEAP's life.
Step by step in MetisTrades
- Go to Top nav → Research → PMCC Analysis, or open
/research/pmccdirectly. - Choose the underlying and the long call.
- Set the short-call assumptions.
- Pick the price scenarios you want compared.
- Read the payback timeline, the scenario summary and the cycle table.
1. Look up the symbol
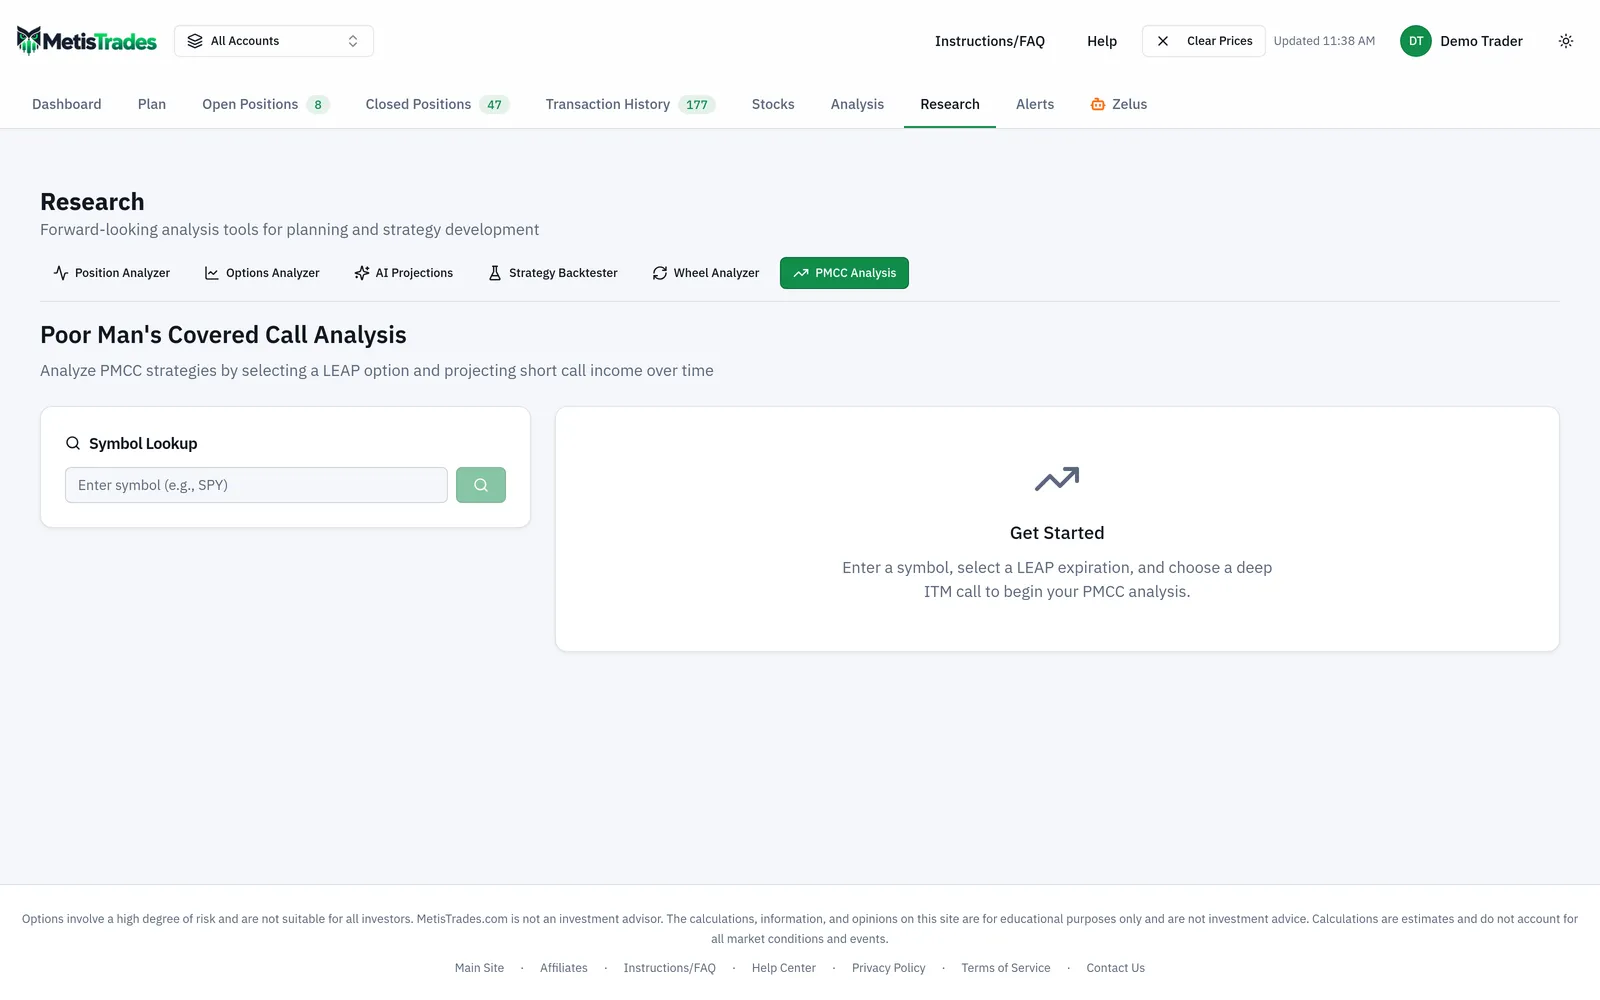
Under Symbol Lookup, type the ticker into Enter symbol (e.g., SPY) and use the search control. The page shows the symbol and the latest available underlying price — $100.00 for XYZ here. If the ticker has no usable chain you see Symbol not found or no options available. To start again from scratch, use Clear analysis and start over.
2. Pick the LEAP expiration and call
LEAP Expiration lists long-dated expirations with at least 180 DTE, each showing its date and DTE. Choose the 420-day expiration.
Select LEAP Call then shows deep in-the-money calls with delta from 0.70 through 0.90. Each candidate card shows its strike, the total marked premium for one contract, Delta, IV and OI. Candidates in that delta range carry a Recommended badge, and in-the-money calls carry ITM. This is a list of candidate cards, not a scored ranking: the page does not calculate a numeric candidate score, and the candidates are listed by ascending strike. If nothing qualifies you see No ITM calls found for this expiration and a suggestion to try a closer expiration.
Select the $75 call at $2,850 with delta 0.82.
3. Fill in Short Call Settings
Under Short Call Settings, choose a Short Call Expiration — the choices run from 1 through 60 DTE, so pick the 35-day one. Target Delta defaults to 0.30 and runs from 0.10 through 0.50 in steps of 0.05; leave it at 0.30. Model ITM Losses is enabled by default; leave it on. Credit Recovery appears when loss modelling is enabled, defaults to 0% and runs from −100% through 100% in 25-point steps.
Credit Recovery describes what happens in a cycle the model treats as a loser. At 0%, a modelled losing cycle loses the full credit amount. At 100%, the model treats the roll as having no loss. Negative recovery models losing the credit plus an additional amount. Starting at 0% keeps the projection from flattering itself.
The app then chooses an out-of-the-money short call with delta above 0.05 and below 0.60 that is closest to your Target Delta, and shows Selected Strike, Delta and Credit (per contract) — the $107 strike at delta 0.31 for $145 in this example. Check that strike: it is what the whole projection is built on.
This is the point where the long call, the short-call settings and the projected results sit on one page together. Look at how the LEAP you chose feeds the short-call selection and the output below it.
4. Choose price scenarios
The default scenario buttons are Bearish (-10%), Flat (0%), Moderate (+5%) and Bullish (+10%), and all four are selected by default. Use Add custom: to enter another percentage and choose Add. These percentages are total stock-price change over the LEAP period, not change per year — over 420 days, +10% means XYZ finishes at $110.00, not $110 after year one.
Before you select a LEAP, the main result area says Get Started and explains the three selection steps. The page saves the symbol, expirations, short-call settings, selected scenarios and custom scenarios in your browser, so the setup is still there next visit.
How to read the results
LEAP Position Summary restates the long side: Strike $75, Premium (Debit) $2,850, Delta 0.82, Expiration 420 days out. Premium Breakdown separates Intrinsic Value ($2,500) from Extrinsic (Time) Value ($350) and shows the extrinsic share — the same 12% you worked out by hand.
The LEAP Payback Timeline charts cumulative short-call credits as a percentage of LEAP cost, with Trade Cycle on the horizontal axis and % Recovered on the vertical axis. Each $145 credit adds $145 ÷ $2,850 = 5.1% of the debit. Two reference lines matter: Extrinsic B/E sits at 12.3% ($350), crossed at cycle 3, and Full B/E sits at 100% ($2,850), which the projected path does not reach inside twelve cycles.
Summary by Scenario lists Initial LEAP Cost, Net Short Call Income, ITM Losses, Extrinsic B/E, Full B/E, LEAP Intrinsic Change, Time Value Decay, Net P/L and Est. ROI. In this run, twelve cycles at $145 would collect $1,740 gross; the summary showed ITM Losses of $290 and Net Short Call Income of $1,450. Time Value Decay is −$350, the extrinsic value modelled away by LEAP expiration. The intrinsic change is simple arithmetic: at $110.00 the $75 call's intrinsic value is $3,500, up $1,000 from $2,500; at $90.00 it is $1,500, down $1,000.
| Scenario | Net Short Call Income | LEAP Intrinsic Change | Time Value Decay | Net P/L | Est. ROI |
|---|---|---|---|---|---|
| Bearish (-10%) | $1,450 | −$1,000 | −$350 | $100 | 3.5% |
| Flat (0%) | $1,450 | $0 | −$350 | $1,100 | 38.6% |
| Moderate (+5%) | $1,450 | +$500 | −$350 | $1,600 | 56.1% |
| Bullish (+10%) | $1,450 | +$1,000 | −$350 | $2,100 | 73.7% |
Net P/L is modelled short-call income plus LEAP intrinsic-value change and time-value decay: for Flat, $1,450 + $0 − $350 = $1,100. Est. ROI is Net P/L divided by the initial LEAP premium: $1,100 ÷ $2,850 = 38.6%. Note how much of the bullish figure is not premium at all — $1,000 of the $2,100 is the LEAP's intrinsic change, which you would have captured holding the long call alone.
Projected Trade Cycles gives one tab per selected scenario, with columns #, Entry, Expiration, Underlying, Strike, Credit/Loss, Cum. Credits, LEAP Intrinsic, Theta Decay and Net P/L. An asterisk on the first cycle means its credit is based on actual market data — the $145 above. Every later cycle is a projection scaled from that first one.
What these numbers do not mean: the Bearish row's $100 is not a floor on your loss, because XYZ could fall far more than 10%. Est. ROI is not an annual return; it spans the 420-day LEAP period. And a crossed Extrinsic B/E line at cycle 3 says the modelled credits covered the time value, not that the position was profitable at that point.
Limits and assumptions
Option prices on this page are latest available delayed quotes, used as reference values. A fill can differ from the marked credit the projection starts from.
Greeks can come from the option data or be estimated when enough inputs are available. For deep in-the-money calls without delta, the page can approximate delta using implied volatility, with 25% used when implied volatility is absent. A contract without a usable delta is excluded from the recommended LEAP candidates, so a thinly quoted strike may simply not appear in the list.
The selection ranges are fixed: LEAP choices require at least 180 DTE, and short-call expiration choices are limited to 1 through 60 DTE. Future strikes use available strikes when possible and otherwise fall back to a rounded strike, so a projected $107 strike in cycle 9 may not be a strike that will actually exist then.
Only the first cycle can use the selected chain's current marked credit. Later credits are scaled projections, time-value decay is a model assumption, and when Model ITM Losses is on the model inserts a losing cycle at an interval based on target delta, then applies your Credit Recovery setting. That mechanism is an assumption about how often short calls go against you — it is not a simulation of when XYZ actually crosses $107.
Scenario results are estimates, not forecasts or investment advice, and the model assumes a new short call is available to sell each cycle at a scaled credit, which may not hold in practice.
Common mistakes
- Reading every cycle credit as a quote. Only the asterisked first cycle uses actual market data; treat the rest as scaled projections.
- Treating scenario percentages as annual. They are total stock-price change over the LEAP period, so +10% on a 420-day LEAP is $100.00 to $110.00 across the whole period.
- Turning off Model ITM Losses or raising Credit Recovery to make the numbers look better. Leave loss modelling on and start Credit Recovery at 0%, where a losing cycle loses the full credit.
- Judging the setup on Est. ROI alone. Subtract LEAP Intrinsic Change from Net P/L to see what short-call income contributed on its own — in the Bullish row that is $2,100 − $1,000 = $1,100.
- Ignoring the extrinsic share in Premium Breakdown. A LEAP with $800 of time value instead of $350 pushes the Extrinsic B/E line more than twice as far out at the same $145 credit.
- Assuming the short call sits where you asked. The app picks an out-of-the-money call with delta above 0.05 and below 0.60 closest to your Target Delta; check Selected Strike and Delta before trusting the credit.
- Expecting the saved setup to be a record of a trade. The page saves the symbol, expirations, short-call settings and scenarios in your browser only; it is a planning input, not position tracking.
Related guides and help pages
Related guides
- Tracking Poor Man's Covered Calls with PMCC Campaigns
- Plan, Track, Optimize: a complete tour of MetisTrades
- PMCC Short Call Went ITM: Roll, Close Both, or Exercise the LEAPS?
- Building and Stress-Testing a Trade in the Position Analyzer
- Screening a Watchlist with the Options Analyzer
- Reading one symbol in depth: the Options Analyzer deep dive