Researching a stock before you sell options on it
Stock Research puts company, price, valuation, fundamentals, dividend, news and ownership information for one symbol on a single page. Here is how to read it before you write a put or a call, and what it cannot tell you.

What it does and when to use it
Stock Research answers one question: what is publicly known about this company right now, and what do I already own of it? It brings company identity, a delayed quote, price history, valuation multiples, trailing-twelve-month fundamentals, dividends, recent news, insider filings and institutional ownership for a single ticker onto one page. If you have entitled account data and hold the symbol, the same page also shows your position in it.
It is a research page, not an order ticket and not a strategy screener. It tells you what kind of business you are about to take an obligation on, when the next dividend dates fall, and what you already hold — the context that decides whether a covered call or a cash-secured put is something you want on your book at all.
A few terms it relies on, in plain words:
- Delayed quote — the latest available stock price. It may not match a current executable market price.
- TTM — trailing twelve months. Each point on the fundamentals charts is a twelve-month total sampled at a fiscal quarter end, not a single quarter's result.
- Forward yield — the annual dividend rate relative to the applicable stock price.
- Payout ratio — the annual dividend rate divided by TTM EPS.
- Ex-dividend date — the date on which buying the stock no longer qualifies you for the next declared dividend. You generally need to own shares before it to receive that payment.
- 13F — a quarterly institutional holdings report. It is backward-looking by construction.
- Assignment — the obligation that lands on an option seller when the holder exercises. A short call assignment normally sells your shares at the strike.
The route is public and does not require sign-in. Anonymous visitors and signed-in users without active access get the market-data research but not account holdings; they see a Position prompt instead — Sign in to see your position in SYMBOL with Start free trial, or See your position in SYMBOL with View plans. Your shares, cost basis, tax lots, transfer basis, transactions and received dividends need entitled account data.
A worked scenario
You own 300 shares of XYZ, bought over two lots, and you are thinking about selling covered calls against them for the first time. Before you look at any strike, you open the research page for XYZ. Here is what it shows.
The header gives the ticker, company name, exchange, sector, industry category and the delayed quote of $48.20, with a short description, CEO, employee count, headquarters and a Company site link.
| Panel | Field | Value |
|---|---|---|
| Valuation | Market cap | $9.6B |
| Valuation | Enterprise value | $11.2B |
| Valuation | P/E | 12.05 |
| Valuation | P/B | 2.4 |
| Valuation | P/S | 1.10 |
| Valuation | EV/EBITDA | 8.3 |
| Valuation | Dividend yield | 2.66% |
| Valuation | Earnings yield | 8.30% |
| Fundamentals | Gross margin | 38.2% |
| Fundamentals | Operating margin | 14.1% |
| Fundamentals | Net margin | 9.0% |
| Fundamentals | Revenue YoY | +4.3% |
| Fundamentals | EPS YoY | −2.1% |
| Fundamentals | Payout ratio | 32% |
| Dividend | Annual rate | $1.28 |
| Dividend | Forward yield | 2.66% |
| Dividend | Per payment | $0.32 |
| Dividend | 5y growth | 6.5% |
| Dividend | Next ex-date | 14 Nov |
| Dividend | Next pay date | 2 Dec |
The arithmetic behind three of those numbers is worth doing by hand, because it tells you what they are made of:
- Payout ratio. The hint on the panel is Annual rate ÷ TTM EPS. With TTM EPS of $4.00: $1.28 ÷ $4.00 = 0.32, or 32%. Just under a third of earnings is going out as dividend.
- Forward yield. $1.28 ÷ $48.20 = 0.02656, or 2.66%. Because it is measured against price, it moves when the price moves even if the payment does not.
- P/E and earnings yield. $48.20 ÷ $4.00 = 12.05. Earnings yield is the same relationship inverted: $4.00 ÷ $48.20 = 8.30%.
Your own side of the page, from entitled account data: Shares 300, Avg cost $44.10, Market value $14,460 (300 × $48.20), Unrealized P/L $1,230 (300 × ($48.20 − $44.10)), Realized P/L $0, and Dividends received $192 — two payments of $0.32 across 300 shares. The Dividend panel adds Your annual income of $384 (300 × $1.28).
Step by step in MetisTrades
1. Open the symbol
Go to the route /research/stock/XYZ directly, or follow the nav path Stocks → Overview → select a stock. Links from a stock allocation entry or a related position also open the symbol's research page. The back button adapts to your access and to whether an anonymous upload is still in your browser session.
2. Read the header before anything else
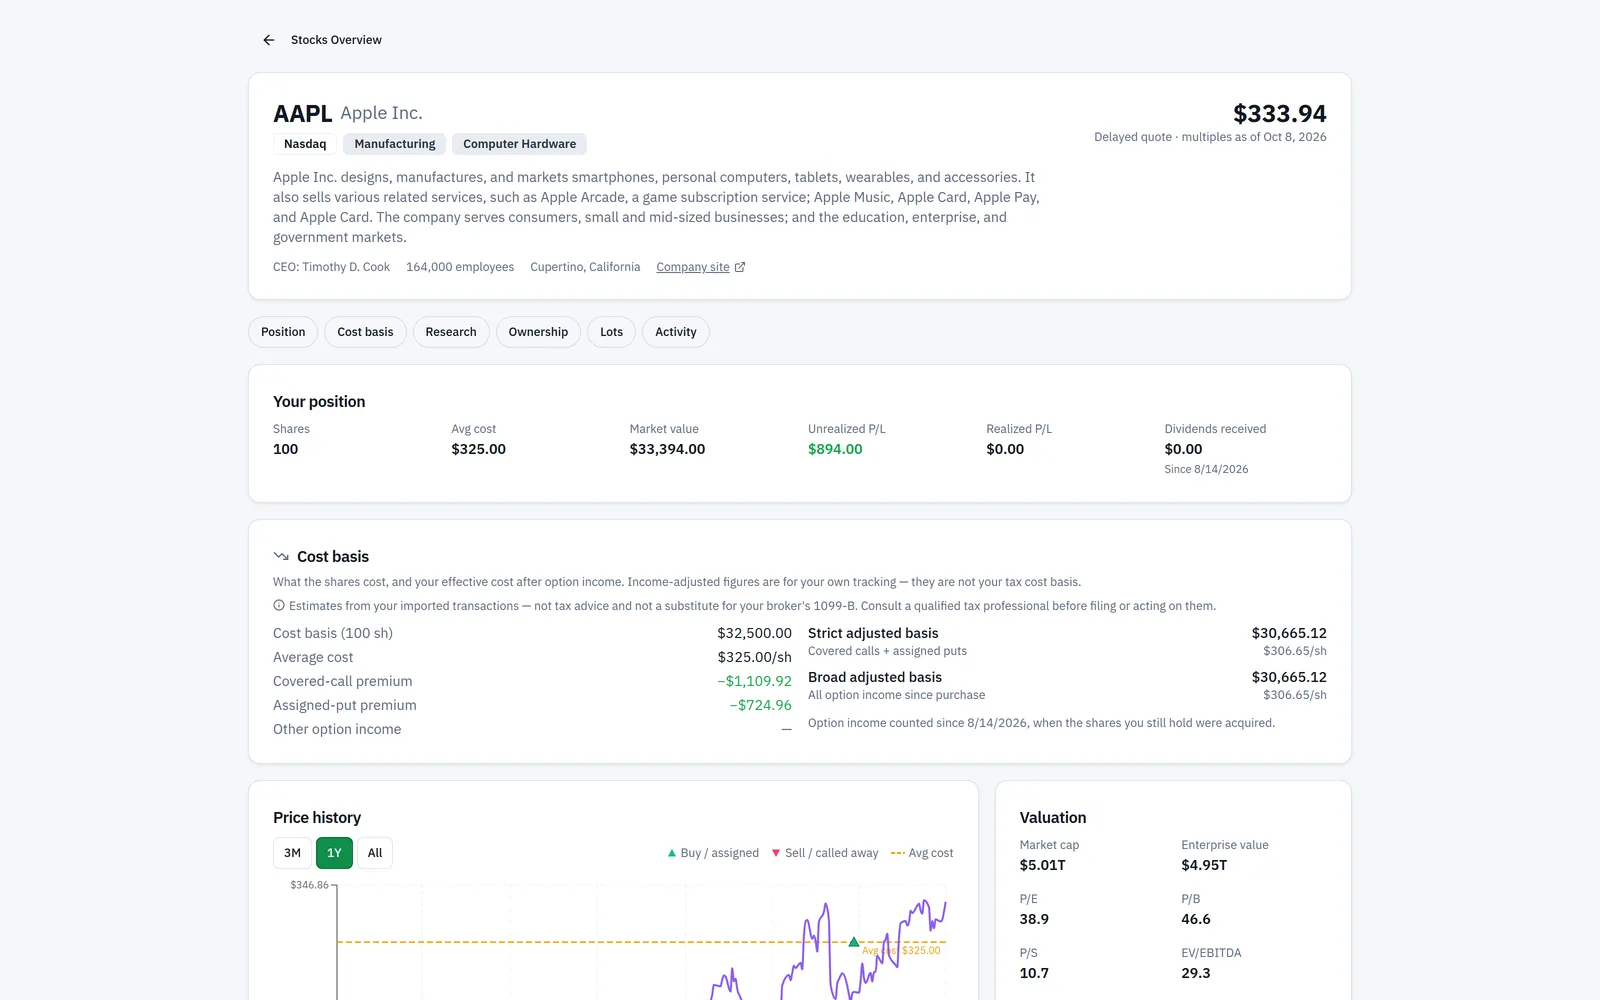
Check the company name, exchange, sector and industry category first. This is also where the quote lives, and where the valuation date appears as multiples as of when that date is available. If a longer company description is supplied, it appears under About COMPANY. For an ETF or fund with no company record, the page explains that profile, valuation and fundamentals are unavailable while price history, dividends and your position can still appear.
The screenshot below shows the page for a held symbol. Note how the company identity and quote sit above the research panels, with your own position presented alongside the market data rather than on a separate page.
3. Use the jump buttons for the sections that exist
The jump buttons appear only for applicable sections and can include Position, Cost basis, Research, Ownership, Transfers, Lots and Activity. Account-specific cost basis, transfer, lot and activity sections appear only when there is corresponding data.
4. Set the price history range
Price history offers 3M, 1Y and All. With account transactions available, chart markers identify Buy / assigned and Sell / called away events, and an Avg cost line appears when the page has an unambiguous positive basis. For the XYZ scenario, the 1Y view puts the $44.10 avg cost line below the current $48.20 and shows where the two buys landed.
If the chart request fails you will see Couldn't load price history for XYZ. Please try again. If it succeeds with nothing in it, you get No price history available for XYZ in this range. Those are different problems: the first is a failure, the second is an empty range.
5. Work down Valuation, then Fundamentals
Read the Valuation panel against the multiples as of date. Then read Fundamentals, whose history is labelled Trailing twelve months, sampled at fiscal quarter ends, charting Revenue (TTM) and EPS (TTM). If either series has fewer than two points, that chart says Not enough history. If there is no standardized record at all, the panel says No standardized fundamentals for this symbol.
6. Check the dividend dates
The Dividend panel gives Annual rate, Forward yield, Per payment, 5y growth, Next ex-date and Next pay date, plus Your annual income for an entitled holding. A Calendar shortcut appears only when you have access to the subscriber dividend calendar. Dates after the last announced payment are estimated from the payment cadence, and if an expected schedule appears late the badge says Payment overdue — schedule may have changed.
7. Finish with news and ownership
Recent news lists each headline with its source and relative publication time, with a summary when one is supplied; the headline opens the source. Insider activity summarises Bought, Sold, Net and Insiders trading, with a table of Date, Insider, Action, Shares, Price and Value. Institutional ownership identifies its 13F quarter when available and shows Held by institutions, Holders, Shares held and Reported value, plus counts that added, trimmed and are new, net share change and Largest holders.
How to read the results
Take the XYZ figures one at a time.
The quote of $48.20 is a reference, not a fill. It is delayed. Your market value of $14,460 and unrealized P/L of $1,230 inherit that delay — they are estimates built from your imported transactions and the latest available price, not a settlement statement.
P/E 12.05 and EV/EBITDA 8.3 describe a price relationship, nothing more. They do not say the stock is cheap; they say what the market is currently paying per unit of earnings and EBITDA, as of the multiples as of date, which can differ from the quote's timestamp.
Revenue YoY +4.3% against EPS YoY −2.1% is a mismatch worth noticing. Sales grew while earnings per share fell. The page does not tell you why. It is a prompt to read the news items and the margin figures — gross 38.2%, operating 14.1%, net 9.0% — not an answer.
The payout ratio of 32% says the dividend is covered by TTM earnings at the current annual rate. It does not forecast the next payment, and because its denominator is TTM EPS, a weak earnings year raises the ratio without the dividend changing at all.
Next ex-date 14 Nov is the date that matters for your covered call. If you sell a call that expires after 14 Nov and it is assigned before the ex-date, your shares are sold at the strike and you do not receive that $96 payment (300 × $0.32). Note that this date may be an estimate from the cadence rather than announced, so treat it as a planning input you re-check.
Insider Net of −42,000 shares across 3 insiders is narrower than it looks. The totals count only open-market purchases and sales reported on Form 4 for the displayed window. Awards, option exercises and tax withholding can appear in the list but are excluded from the buy and sell totals, as are derivative legs. A chunk of selling may simply be scheduled or routine; the page does not interpret motive.
Institutional ownership is a snapshot of a finished quarter. "412 holders, 71% held by institutions, 96 added, 118 trimmed, net −2.4M shares" describes positions as reported for that 13F quarter. Managers can report after the quarter ends, so the real position today may already be different.
What none of this tells you: whether the premium on any particular strike is worth taking. Option pricing, implied volatility and probability live in the research analyzers, not here.
Limits and assumptions
Quotes are delayed, and the valuation record can carry its own separate as-of date. Treat every price-derived figure on the page — market value, unrealized P/L, forward yield, the multiples — as a reference value rather than something you could transact at.
Company records, standardized fundamentals, news, dividend history, insider filings and institutional holdings all depend on provider coverage and entitlement. If a market-data provider is not configured, the page says that only your own position is shown. ETFs and funds do not have the company record that profile, valuation and fundamentals require, so those panels are unavailable for them even though price history, dividends and your position can still appear.
The page deliberately keeps four different outcomes apart for ownership data, and it is worth knowing which you are looking at:
- Not entitled — the provider plan does not include the dataset, so the panel is hidden.
- No record for this symbol — the provider has no company or identifier record, so the panel is hidden.
- Genuinely empty — the provider confirms access and returns zero rows, so the panel stays visible with its written empty state, such as No insider filings for this company. or No institutional holders reported for this symbol.
- Provider failure or soft deadline — the panel says Still loading insider filings — refresh in a moment. or Still loading institutional holdings — refresh in a moment. A provider failure is not treated or cached as an empty answer.
The same pending pattern applies to valuation, fundamentals, dividends and news when one of those sections misses the page's loading deadline. Sections load in parallel, so a late section is not a statement that there is no data.
Dividend dates projected after the last announced payment are estimates from the detected cadence and can change. Your position, cost basis, realized and unrealized P/L, lots and dividend income are estimates from your imported transactions — missing trades, transfers or assignments change them. Tax-related figures are estimates too, not tax advice and not a substitute for your broker's 1099-B. All of this is research input. It is not investment advice, and none of it predicts what a stock or an option will do.
Common mistakes
- Treating the delayed quote as the price you can trade at. Fix: use it to frame the research, and price any option order against the live market at your broker.
- Reading the Revenue (TTM) and EPS (TTM) charts as quarterly results. Fix: remember the label — each point is a twelve-month total sampled at a fiscal quarter end, so one weak quarter is smoothed across four points.
- Selling a call across an ex-dividend date without checking it. Fix: read Next ex-date first, and remember it may be estimated from the cadence rather than announced.
- Reading a large Insider "Sold" number as a verdict on the company. Fix: open the filing table — the totals exclude awards, option exercises, tax withholding and derivative legs, and selling can be routine.
- Taking 13F ownership as today's positioning. Fix: check the quarter the panel identifies and treat the numbers as backward-looking.
- Assuming a hidden panel means zero. Fix: a hidden card means not entitled or no provider record; only a confirmed zero-row response shows the written empty state.
- Concluding "no data" when a section is still pending. Fix: if it says it is still loading, refresh in a moment rather than recording an absence.
Related guides and help pages
Related guides
- Plan, Track, Optimize: a complete tour of MetisTrades
- Building and Stress-Testing a Trade in the Position Analyzer
- Screening a Watchlist with the Options Analyzer
- Reading one symbol in depth: the Options Analyzer deep dive
- Backtesting an Options Strategy with the Strategy Backtester
- Replaying one options trade with Trade Backtest