Earnings land before your short put expires: close, hold, or roll past the report?
You sold a month-out put and then saw earnings on the calendar. Here are the three real choices, close, hold or roll, run through one priced NVDA example so you can see what each one costs and risks.
You sold a put about a month out, felt pretty good about it, and then noticed the earnings report sits right in the middle of the trade. Now you have to decide this week: buy it back, hold it through the report, or roll it somewhere else. This post runs all three choices through one priced example so you can see the trade-offs in dollars, not slogans.
The situation
Here's the spot, in plain words.
You sold a put with 30-45 days to expiration (DTE – days to expiration, ie. calendar days until the contract stops existing).
You didn't check the earnings calendar first.
The report is next week, and your put expires after it.
So the question you're typing into a search bar is some version of: "Do I close this short put before earnings, or hold it through?"
The thing is, most of what you'll find is a rule. "Never sell through earnings." "Always close a week before." "Sell through earnings to harvest the IV crush."
Rules are fine. But they're written for someone who hasn't placed the trade yet.
You already have.
And the right answer for an open position depends on stuff a rule can't see: whether the put is currently winning or losing, how far your strike is from the stock price, and whether you'd actually be OK owning the shares.
Why isn't this obvious? Two things pull in opposite directions at the same time:
- Implied volatility (IV) – the amount of movement the market is pricing into options. It usually climbs before a report and drops after. When it drops, your short put tends to get cheaper, which helps you.
- The gap – the stock can open well above or well below where it closed the night before. A big gap down toward or through your strike hurts you, and no amount of IV crush makes up for it.
The one number that connects these is the implied move – roughly, how far the options market is pricing the stock to move on the report, usually read from the at-the-money straddle (a call plus a put at the same strike) for the first expiration after the report.
It is NOT a forecast.
It's the market's price for uncertainty. The stock can move less, more, or about that much. I don't know which, and neither does anyone else.
The realistic choices
Let's go down the list. There are three choices most traders really have here.
1. Buy the put back before the report
What it buys you – you're out. No gap risk, no assignment risk, no cash tied up securing the put.
What it gives up – whatever the put is worth right now gets paid out of your pocket. If the put is losing, that loss becomes real. If it's winning, you keep less than the full premium. And you give up the IV drop that might have worked in your favor after the report.
2. Hold the put through earnings
What it buys you – no trade today, no commission today, and you keep the chance at the full premium plus whatever IV crush does for you.
What it gives up – you're taking the gap. If the stock drops hard, the put can be worth a lot more the morning after, and you may end up owning 100 shares per contract.
3. Roll down and out past the report
Rolling – buying back your current put and selling a new one in the same trade, usually at a different strike, a later expiration, or both.
What it buys you – often a credit, a lower strike (ie. more room before the shares are yours), and more time.
What it gives up – more days in the trade, and here's the part people miss: if the new expiration is also after the report, you are still holding through earnings. You moved the strike. You didn't move the report.
"But, but, but, rolling is how you get out of trouble!!"
Sometimes. Sometimes it's how you kick the can down the road and hide a loss behind a fresh credit. The worked example shows which is which.
The worked example
Here's the setup. These are example prices, not a live quote.
Nine days ago, with NVDA at $173.96, a trader sold one $155 put for $4.56 (priced with a pricing model at 55% volatility). That's $456 collected per contract ($4.56 × 100).
Since then, the stock slipped to an illustrative $168.89. The put now has 31 days left and marks at $5.85 (option chain mid).
So the put is currently losing. You sold it for $4.56, and it would cost $5.85 to buy back.
The roll on the table: buy back the $155 put at $5.85 and sell the 66-day $150 put at $6.72. That's a net credit of $0.87 per share ($6.72 − $5.85), or $87 per contract.
The spreadsheet below has this exact example with its formulas, one row per choice, plus room for your own rows.
Download the template: Short put sold a month out, earnings report next week — choices compared (.xlsx). It opens in Excel, and in Google Sheets via File → Import. The worked example from this guide is already filled in, and the formulas carry down into the blank rows.
And here's what it computes, per one contract:
| Choice | Cash today | Breakeven stock price | Capital tied up | Locked-in P/L if you end flat | Whole-trade worst case (stock to $0) |
|---|---|---|---|---|---|
| Buy the put back before the report | −$585 | none (no position left) | $0 | −$129 | −$129 |
| Hold the put through earnings | $0 | $150.44 | $15,500 | open | −$15,044 |
| Roll down and out to the 66-day $150 put | +$87 | $144.57 | $15,000 | open | −$14,457 |
Let's walk through the arithmetic, row by row.
Close: the loss becomes real
Cash today = −$5.85 × 1 contract × 100 = −$585.
Locked-in P/L = (premium in + cash today) × 100; ie. ($4.56 − $5.85) × 100 = −$129.
That's it. That's the whole outcome. −$129 no matter what the stock does next week. It's the only row where the worst case and the locked-in result are the same number.
Hold: the breakeven is your effective cost basis
Breakeven = strike − premium collected; ie. $155 − $4.56 = $150.44.
If you get assigned, $150.44 is effectively what you paid for each share. So this is the question the hold row really asks you: would I be comfortable owning 100 shares of NVDA at $150.44, the morning after a bad report?
Capital tied up = $155 × 100 = $15,500, the cash securing the put.
Whole-trade worst case = ($4.56 − $155) × 100 = −$15,044. The stock going to $0 isn't a realistic earnings outcome for most names; it's the structural floor of the position, and it's the number a short put actually puts on the line.
Roll: lower strike, bigger cushion, same report
Cash today = +$0.87 × 100 = +$87.
Breakeven = new strike − everything collected; ie. $150 − $4.56 − $0.87 = $144.57.
Capital tied up = $150 × 100 = $15,000.
Worst case = ($4.56 + $0.87 − $150) × 100 = −$14,457.
So the roll moves your breakeven down from $150.44 to $144.57 and brings in $87. In exchange, you add 35 days to the trade.
And (say it with me) the 66-day put still expires after the report. The gap risk didn't go anywhere. You just met it with a lower strike.
What about flat, 1× the implied move, and 2× the implied move?
This is the grid everybody wants, and I'm NOT going to make up numbers for it.
The spreadsheet above doesn't price post-earnings scenarios, and any figure I typed here would be a guess dressed up as math. Instead, the Position Analyzer can do it for this exact position (more on that in the last section). Here's how to read each outcome in words:
- Stock roughly flat – IV usually drops after the report, so a short put typically loses value faster than time decay alone would explain. Hold and roll both tend to benefit here. Close doesn't, because you already paid $585.
- Stock moves down by about the implied move – this is where your strike's distance matters. Is the stock above or below $150.44 (hold) or $144.57 (roll) after that move? That's the line between a smaller loss and assignment-territory.
- Stock moves down by about 2× the implied move – IV crush won't save you here. The put is mostly intrinsic value (ie. how far the stock is below the strike), and that part doesn't decay away.
"Ok, but what if it only moves 2% and IV collapses?" Then the drop in IV is likely the bigger force on the put's price, and it usually works in a seller's favor. How much? Run it, don't trust me on it.
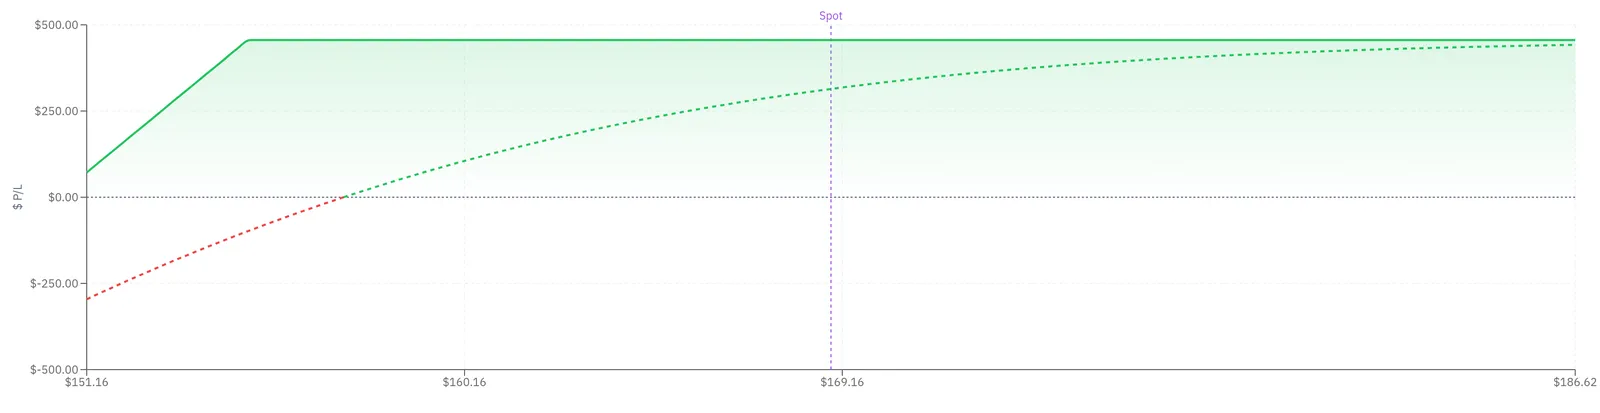
Below, the same position loaded in the Position Analyzer at the example's $168.89 share price. Look at where the dashed Today curve sits against the solid expiration curve, and where the BE marker lands relative to Spot.
The decision rule
This isn't a "do this" rule. It's a set of if-then checks. The point is to make the choice with your eyes open.
- If you would NOT want to own 100 shares at your breakeven ($150.44 here) after a bad report, then holding doesn't fit you. Close, or only roll if the new breakeven ($144.57 here) is a price you WOULD own it at.
- If you would be fine owning the shares at that price, then holding is a real choice, and assignment is an outcome you planned for, not a disaster.
- If the roll only works because the credit hides a loss (ie. you'd close for −$129 today but roll so you don't have to see it), then be honest about it. The −$129 still happened. It's sitting inside a longer, still-open trade.
- If $15,000-$15,500 tied up for another month or two is more than you want parked in one name over a report, then closing and freeing it is a legitimate reason all on its own.
- If the put were already profitable (not our example), then closing locks in a gain, even below a 50%-of-max-profit target. The trade-off is giving up the rest of the premium and any post-report IV drop in exchange for skipping the gap.
- If you're thinking "close now, re-sell after the report", then count the cost: you pay to close, pay a second commission to re-open, and the new put is sold after IV has likely dropped, so it may bring in less premium than the one you just bought back.
The honest limits:
This rule doesn't know what the stock will do. Nothing does.
It doesn't know your ticker's history of moves versus its implied moves. Some stocks often move less than priced, some often move more. Look that up for your name.
And it doesn't know your account. Taking one loss is very different from taking it when it's 30% of your portfolio.
We also ran a skip-earnings backtest on NVDA as a separate data study, to see whether sitting out the reports changed long-run results. Read it as one stock, one period, one set of rules. It's useful context and it is NOT proof for your ticker.
Run it on your own numbers
Here's the link that opens this exact position in the Position Analyzer with the leg already filled in.
Run it on your own numbers: Open this NVDA example in the MetisTrades Position Analyzer and change the strike, expiration and prices to yours
Once it's open, change things to match your trade:
- Symbol – enter your ticker and select Load. The page shows the Underlying price (delayed, not a live tick).
- Strike, Expiration and Entry price – edit the leg in the Rail or Table view. Set Sell (short), Put, your contracts, and the premium you actually collected per share.
- Price – Natural uses the bid for a short leg and the ask for a long one, a more conservative fill than Mid. If the spreads are stale from a prior session, the page forces Mid.
Now run the three outcomes:
- Move Days forward to the day after the report.
- Move IV adjustment down (it goes from −50 to +100 volatility points) to model the post-report IV drop. Try a few levels, since you don't know how much it'll fall.
- Read the dashed curve at three prices: today's price, today's price minus your implied move, and minus twice your implied move. Or switch from Graph to Table for the Profit / loss heatmap, where rows are prices and columns are dates.
To compare the roll, add a second scenario with the new strike and expiration and the combined premium, and check where Breakevens moves under Payoff at expiration.
Pro users also see Probability of profit, Expected value and Tail risk (avg worst 5%). Those are model estimates using current IV, not promises, and they don't know a report is coming any better than the option prices do.
Then drop your numbers into the spreadsheet rows and see your own cash today, breakeven, capital tied up and worst case side by side.
The moral of the story…
Closing isn't safe-and-boring. It's a known loss or gain.
Holding isn't brave. It's a bet you've agreed to own the shares.
Rolling isn't an escape. It's the same report with a different strike.
Please, please, please run it on your own position and tell me if the numbers say something different for your ticker. Did this help you think through the trade you're actually sitting in?
Related guides and help pages
Related guides
- The stock blew past your covered call strike in a week: is buying the call back worth it?
- Your short put is deep in the money with a week left: take assignment, roll, or close?
- Covered call in the money before expiration: let the shares go, roll up and out, or buy it back?
- One leg of your credit spread was assigned early: the cleanup, step by step
- A gap blew through your short strangle: damage control without doubling down
- Assigned and 15% under water: where do you sell the first covered call?