A gap blew through your short strangle: damage control without doubling down
Your short strangle woke up with the stock past the call strike. Here is what closing, rolling the put up, adding wings, or buying back only the call each leaves you holding from here, on one NVDA example.
You sold a short strangle, the stock gapped straight through your call strike, and the buy-back price is now bigger than the credit you collected. This post walks through the realistic exits and the risk each one leaves you holding from here, and it ends with a rule for choosing that doesn't depend on guessing where the stock goes next.
The situation
You sold a strangle.
Strangle – one short call above the stock and one short put below it, same expiration. You get paid as long as the stock stays between the two strikes.
It was a nice, quiet trade.
Then the stock ripped through the call strike, and now you're looking at your broker going "what the $*@^ happened?"
The question in your head is usually some mix of these:
"Do I close it now, or wait for a bounce?"
"Can I roll something and make this go away?"
"Should I just buy some wings and turn it into an iron condor?"
Here's why this isn't obvious.
Every exit option sounds reasonable. Most management guides tell you to roll the untested side (ie. the side the stock moved AWAY from) toward the stock for more credit. Most risk-rule guides tell you to close when the loss hits some multiple of the credit. Both camps are measuring from the credit you took in or the loss you already have.
That's the wrong ruler.
The credit is gone. The loss is already on the books. Neither one changes what happens on the next move.
The only thing you can still control is how much MORE you can lose from here...
The realistic choices
Quick vocabulary first:
Tested side – the short option the stock moved toward. Here, the call.
Untested side – the short option the stock moved away from. Here, the put.
Delta – roughly how many dollars the position gains or loses for a $1 move in the stock. A short call that's in the money has a big negative delta, so you're effectively short a pile of stock.
Gamma – how fast delta changes as the stock moves. Short options carry negative gamma, which means the position gets MORE short as the stock rises against you. That's the thing that hurts on a second move.
Wings – long options bought further out than your short strikes, so the loss stops growing past them. Short strangle + wings = iron condor.
Let's go down the list.
1. Close the whole strangle
What it buys – zero remaining risk. The loss is locked and the next gap is somebody else's problem.
What it gives up – any chance of the stock coming back. Also, you pay the full spread on two legs.
2. Roll the untested put up toward the stock
Buy back the faded put, sell a put closer to the current price, same expiration.
What it buys – a fresh credit and less negative delta, because the new short put has positive delta that leans against the short call.
What it gives up – your profit zone gets narrower, the put strike moves much closer to the stock, and the call is still naked. So a move down now hurts sooner, and a move up still has no ceiling. You've added short gamma, not removed it.
3. Buy wings and turn it into an iron condor
Buy a call above the short call and a put below the short put.
What it buys – a hard cap on the loss in both directions.
What it gives up – the wings cost money, and after a gap the call wing is closer to the money, so it's expensive. Simply put, you're paying up for insurance after the house already caught fire. Not to mention the cap might sit at a bigger loss than closing does.
4. Buy back only the tested call, keep the put
What it buys – the upside risk is gone completely.
What it gives up – you still hold a naked short put. If the stock reverses hard, that put becomes the problem.
5. Hold and wait for a bounce
This one's real; people do it all the time.
What it buys – the chance the stock drifts back under the call strike.
What it gives up – nothing is capped. The short call keeps its full upside risk, and you're betting on direction (which, honestly, nobody knows).
And the classic "but, but, but!" option: roll the tested call out in time for a credit. I'll be straight with you: that doesn't fix the strike problem, it pushes it to a later date and keeps the position naked. It might be fine, it might not. I didn't price it in this example, so check the chain yourself and run it through the same comparison below.
The worked example
Let's run the scenarios.
Example prices, NOT a live quote. NVDA at an illustrative $168.89.
Ten days ago, with NVDA at $145.25, the strangle was opened:
Sold the $165 call at $4.58
Sold the $125 put at $3.02
Credit: ($4.58 + $3.02) × 100 = $760.
Now there are 24 days left. The $165 call is in the money and marks at $13.02. The $125 put has faded to $0.87.
Close both: ($13.02 + $0.87) × 100 = $1389 debit.
So the buy-back is bigger than the whole credit. Ouch.
The other prices from the same chain:
Roll the put: buy back the $125 put at $0.87, sell the 24-day $150 put at $3.97. Net credit ($3.97 − $0.87) × 100 = $310.
Wings: buy the 24-day $180 call at $6.25 and the 24-day $115 put at $0.48. Net debit ($6.25 + $0.48) × 100 = $673.
Call only: $13.02 × 100 = $1302 debit.
The spreadsheet below has every choice set up with its formulas. Each row adds the cash so far, the cash today, and what the options are worth at expiration at whatever stock price you type in.
Download the template: Short strangle after an overnight gap through the call strike — choices compared (.xlsx). It opens in Excel, and in Google Sheets via File → Import. The worked example from this guide is already filled in, and the formulas carry down into the blank rows.
Here's what it computes. All whole-position dollars (one contract = 100 shares), valued at the shared expiration.
Choice | Cash before today | Cash today | P/L at expiration at $168.89 | P/L if stock goes to $0 | Worst case | Best case |
|---|---|---|---|---|---|---|
Close the whole strangle | +$760 | −$1389 | −$629 | −$629 | −$629 | −$629 |
Roll the put up to the $150 put | +$760 | +$310 | +$681 | −$13930 | Unlimited | +$1070 |
Iron condor ($180 call, $115 put wings) | +$760 | −$673 | −$302 | −$913 | −$1413 | +$87 |
Buy back only the call, keep the put | +$760 | −$1302 | −$542 | −$13042 | −$13042 | −$542 |
Formula, in words: P/L = cash before today + cash today + what the remaining options pay out at expiration.
ie. for the close row: 760 − 1389 = −629. Done, nothing left open.
Close
Every column says −$629. Boring!
That's the point. It's the only row where the worst case and the best case are the same number.
Roll the put up
Cash in: 760 + 310 = 1070. That's the best case, and you only get it if NVDA finishes between $150 and $165.
At $168.89 it shows +$681, which looks lovely. Don't fall for it. That number assumes the stock sits still for 24 days.
Look at the other columns. Worst case: Unlimited, because the $165 call is still naked. And if the stock reverses all the way down, the new $150 put drags you to −$13930.
The moral of the story: the roll raised your credit and cut your delta, but it moved a short strike from $125 up to $150. A second move in EITHER direction now hurts more than it did yesterday.
Iron condor
Cash: 760 − 673 = 87. That $87 is the best case, between $125 and $165.
Worst case on the upside: −$1413, at $180 or above. That's the $87 minus the width between the $165 and $180 strikes (times 100). Downside cap: −$913, at $115 or below.
Here's what surprised me. The capped worst case (−$1413) is a BIGGER loss than just closing (−$629). The wings cost $673 because the stock is already near them.
So the condor isn't "safer than closing." It's "capped instead of unlimited," and you pay for the cap.
Call only
Cash: 760 − 1302 = −542. That's the best case; the put can only make it worse from here.
Worst case: −$13042 if the stock goes to zero. Unlikely? Sure. Capped? Nope.
The thing is, the "P/L at $168.89" column is the one everyone stares at, and it's the least useful. Read across to Worst case. That's the risk you're actually choosing.
The decision rule
Notice something about the table: every row starts with the same +$760.
The old credit is in every choice, so it can't help you pick between them. Same for the loss already taken. Sunk is sunk.
So the rule only looks forward:
Write down the most additional loss you'd accept from here. Not from entry. From here, measured against the −$629 you'd lock in by closing now.
For each choice, look at its Worst case. The gap between that and −$629 is the extra loss you're signing up for.
If a choice's worst case is "Unlimited," it fails, full stop. You can't fit unlimited inside any number.
If one or more capped choices fit your number, then pick among those, and know exactly what you're paying (the $673 wing debit, in this case).
If nothing fits, then close.
Run through it here: the put roll fails rule 3. Holding as-is fails rule 3. Call-only has a capped number on paper, but it's −$13042, which won't fit most people's answer. The condor fits only if you're OK with the gap between −$629 and −$1413. If you're not... close.
"Wait for a bounce" isn't a rule. It's a forecast. I don't know which way NVDA moves from $168.89, and neither does anyone else.
The honest limits
This rule doesn't say which choice makes the most money. Nothing can, without knowing the future.
Expiration curves ignore the path. Before expiration, an in-the-money short call (American style, like most equity options) can be assigned early, especially when it has little time value left or a dividend is coming. That leaves you short 100 shares overnight. Your broker handles that, not the spreadsheet.
Margin on naked short options usually climbs as they go deeper in the money. Your broker sets that number; check it there before you pick a choice that keeps the position naked.
Stops don't save you from gaps. A stop can fill well past its level when the stock opens somewhere else.
Common conventions like "close at 2x the credit" or "manage at 21 days" are just that, conventions. They measure from the credit. This rule measures from your risk budget.
And for next time: size the strangle so that a gap this big, on a naked short, is a loss your account can actually take. If the worst-case math above made your stomach drop, the size was the problem, not the adjustment.
Run it on your own numbers
Simply put: same table, your strikes, your prices.
In the spreadsheet
Net cash before today – your original credit (whole position).
Cash today – what each choice costs or pays at your broker's current prices. Credits positive, debits negative.
Option columns – the contracts still open after the choice. Negative for short, positive for long.
Stock price at expiration – try your own. This is where you run the "second move" stress test: type in a price further past the call, then one well below the put, and watch each row.
There's no hold row in the sheet. Add one: your credit, zero cash today, and your two original short strikes.
In the Position Analyzer
The link below opens this exact strangle with the legs filled in.
Run it on your own numbers: Open this NVDA example in the MetisTrades Position Analyzer and change the strike, expiration and prices to yours
When it opens, check the Payoff at expiration stats first. Max loss should read Unlimited for the plain strangle. Then look at the Profit / loss diagram: the solid curve is At expiration, the dashed curve is Today, and Spot marks the stock at $168.89, already past the call strike on the red side.
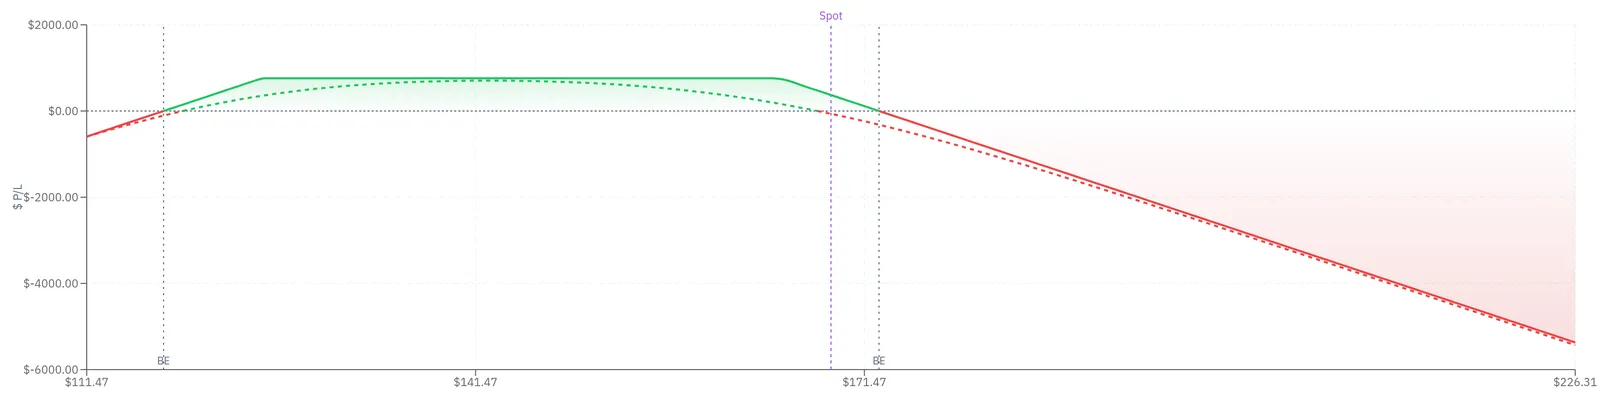
The worked example in the Position Analyzer: Short strangle after an overnight gap through the call strike, at the example's share price of $168.89.
Now change the legs to match each choice, one at a time:
Roll – change the $125 put's strike to $150 and its entry price to the new fill. Max loss stays Unlimited, and the profit area squeezes between the two short strikes.
Condor – use Add leg for a long $180 call and a long $115 put. Max loss turns into a number, and Credit / width shows up because it's now a capped-loss credit position.
Then swap in your own symbol, strikes and expiration with Symbol and Load.
A few things worth knowing while you poke at it:
Delta is right there for free, so you can see how much each choice cuts your short exposure. Gamma, Theta and Vega are Pro.
Move Days forward and watch the dashed curve slide toward the solid one. That's time doing its thing.
Price switches between Mid and Natural. Natural assumes the worse fill, which is the honest one after a gap when spreads are wide.
Quotes are delayed. Treat every mark as a reference, not a fill.
The analyzer doesn't place or close trades. Your broker does that part.
Please, please, please rerun this with your own strangle and your own chain. If my framing breaks on your numbers, I want to know.
It's not about the credit you took in.
It's not about the loss you already have.
It's about the worst case you're willing to own from here.
So, was this useful? And what number did you write down for step one?
Related guides and help pages
Related guides
One leg of your credit spread was assigned early: the cleanup, step by step
Short option at 80% profit with weeks left: close it and redeploy, or wait?
Your short put is deep in the money with a week left: take assignment, roll, or close?
Covered call in the money before expiration: let the shares go, roll up and out, or buy it back?
The stock blew past your covered call strike in a week: is buying the call back worth it?
Assigned early on a covered call the day before ex-dividend: what happened and what to do now