One leg of your credit spread was assigned early: the cleanup, step by step
Your short put got assigned and now the account shows 100 shares, a giant cash debit and a lonely long put. Here is why the loss is still capped, and the three ways to clean it up, with the cash each one needs.
You opened a credit spread, you logged in, and the spread is gone. In its place there are 100 shares you didn't buy, a cash balance with a minus sign the size of a car loan, and one long option sitting there by itself. This post answers the question you're actually asking: is my loss still capped, and what do I do in the next hour?
The situation
Here's the setup we'll use for the whole post. These are example prices, not a live quote.
Twenty-five days ago, with SPY at $794.92, the trade was a bull put spread. That's a put credit spread, ie. you sell a higher-strike put and buy a lower-strike put for protection.
Sold one $780 put for $8.29 (that's $829 in)
Bought one $762 put for $3.74 (that's $374 out)
Then SPY fell to an illustrative $749.92.
And the short $780 put got assigned. Early. With 10 days still on the clock.
Assignment – the option seller has to make good on the contract because the holder exercised it. For a short put, that means you buy 100 shares at the strike, whether you like the price or not.
So the account bought 100 shares at $780. That's $78,000 out the door.
The $762 put is still yours, still open, still worth something. It marks at $14.25.
And now the account looks like this:
100 SPY shares
1 long $762 put, 10 days left
Net cash for the whole position: −$77,545.00
"Wait, WHAT?! I sold a defined-risk spread! Why do I suddenly owe $77,545!!1!"
Breathe. The shares are worth most of that. The number looks scary because the account now shows the stock and the cash as two separate things instead of one tidy spread.
Who runs into this, and why it's not obvious
Anyone who sells verticals long enough. Bull put spreads get you long shares. Bear call spreads (sell a lower-strike call, buy a higher-strike call) get you SHORT shares, which is its own headache, and we'll get to it.
It's not obvious for three reasons:
The long leg does NOT get exercised automatically when the short leg is assigned. Only your short leg was touched. The long option is your call to make.
The cash swing is massive compared to the risk you thought you were taking.
Most explanations stop at "your loss is still capped, don't panic" and never show you the numbers.
So, why were you assigned early when there were 10 days left?
Look at the short put's price. The $780 put marks at $29.40. But it's in the money by $780 minus $749.92, which is MORE than $29.40.
Simply put, the market was paying nothing for its remaining time. When an option has no time value left, the holder loses nothing by exercising early, so somebody did.
Deep in the money plus little time value equals early assignment risk. On the call side, the classic trigger is the day before an ex-dividend date (the date after which new buyers don't get the next dividend), because the call holder wants the dividend more than the call's leftover time value.
The realistic choices
Let's go down the list. There are three real ones.
1. Exercise the long $762 put
Exercise – you, the holder, use the contract's right. A put lets you sell 100 shares at its strike.
So you exercise the $762 put and the 100 shares you got at $780 go out the door at $762. Cash comes back: $76,200.
What it buys – a clean, mechanical exit. No bid/ask spread on either leg. The shares and the put cancel each other out.
What it gives up – any time value left in the $762 put. Exercising only pays you the put's intrinsic value, ie. how far in the money it is. Whatever the market would've paid you on top of that, you leave on the table.
2. Sell the long put and sell the shares
Sell the $762 put at $14.25 ($1,425 in) and sell the 100 shares at $749.92 ($74,992 in). Total cash back: $76,417.
What it buys – you keep the put's leftover time value.
What it gives up – you're crossing two bid/ask spreads, and the fills can be worse than the marks. Also, if you do the two sales one at a time, there's a gap where you're holding one piece without the other. More on that below.
3. Hold the shares and the put to expiration
Do nothing today. Keep the 100 shares, keep the $762 put as protection. Cash today: $0.
What it buys – if SPY climbs back over the next 10 days, the shares participate. The put still sets a floor at $762.
What it gives up – you're carrying $77,545 of debit (or tying up cash) for 10 more days, and the put's time value bleeds away toward zero by expiration.
Is "do nothing" really a choice? Here, yes. But ONLY if your account can actually carry the shares. If it can't, your broker may make the choice for you. More on that in the rule section.
The worked example
Same starting ledger, three endings. Before the table, here's the ledger the whole thing is built from, written the way the cash flows hit the account:
When | What happened | Cash (whole position) |
|---|---|---|
25 days ago | Sold 1 SPY $780 put at $8.29 | +$829 |
25 days ago | Bought 1 SPY $762 put at $3.74 | −$374 |
Assignment | $780 put assigned: bought 100 shares at $780 | −$78,000 |
Running total | 100 shares + 1 long $762 put still open | −$77,545 |
Net cash before today = credit − debit − cost of shares; ie. $829 − $374 − $78,000 = −$77,545.
The spreadsheet below runs every choice off that one ledger, with the formulas visible. It already has this example filled in, and you can add your own rows underneath.
Download the template: Bull put spread, short put assigned early, long put still open — choices compared (.xlsx). It opens in Excel, and in Google Sheets via File → Import. The worked example from this guide is already filled in, and the formulas carry down into the blank rows.
Here's what it computes:
Choice | Net cash before today | Cash today | Shares after | Options left | P/L at expiration at $749.92 | Worst case at expiration | Best case at expiration |
|---|---|---|---|---|---|---|---|
Exercise the $762 put to deliver the shares | −$77,545 | +$76,200 | 0 | None | −$1,345 | −$1,345 | −$1,345 |
Sell the put and sell the shares at market | −$77,545 | +$76,417 | 0 | None | −$1,128 | −$1,128 | −$1,128 |
Hold the shares and the put to expiration | −$77,545 | $0 | 100 | 1 long $762 put | −$1,345 | −$1,345 | Unlimited |
Let's run the scenarios one row at a time.
Row 1: exercise
P/L = net cash before + cash today; ie. −$77,545 + $76,200 = −$1,345.
Now the part everyone says and nobody shows. Is that really "width minus credit"?
Width is the distance between the strikes ($780 − $762). Credit is what you collected net ($8.29 − $3.74). Take the width, subtract the credit, multiply by 100 for the contract, and you land exactly on −$1,345.
That's the spread's max loss. The one you signed up for on day one.
Assignment didn't change it.
Why? Because the shares came in at $780 and the long put can always push them out at $762. The worst you can lose on the stock is the gap between those two prices. The credit you collected softens it. Done.
Row 2: sell both
P/L = −$77,545 + $1,425 + $74,992 = −$1,128.
That's BETTER than the max loss. How?!
Because the $762 put is worth more on the market than its intrinsic value. Exercising pays you only the in-the-money amount ($762 − $749.92 per share). Selling it at $14.25 pays you that plus whatever time value is left with 10 days to go.
The gap between −$1,345 and −$1,128 is that leftover time value. Exercising throws it away.
Of course, this assumes you actually get filled at $14.25 and $749.92. Those are marks, not guaranteed prices, and quotes are delayed. Your fills could be better or worse.
Row 3: hold
Nothing happens today, so cash today is $0. The −$1,345 in the P/L column is what you'd have IF SPY sits at $749.92 on expiration day and you exercise the put then.
Notice it's the same as Row 1. By expiration, the put's time value is gone, so holding to the end and exercising is just exercising today with extra waiting (and extra financing).
The worst case is still −$1,345, because the put caps the downside at $762 no matter how far SPY falls.
The best case says Unlimited because you own shares, and shares have no ceiling. That's the honest math, not a forecast. I don't know which way SPY goes in the next 10 days, and neither does anyone else. Up means the shares recover. Down means the put floors you at −$1,345. Sideways means you waited 10 days to get Row 1.
The moral of the table
Every row reconciles back to the same spread.
Rows 1 and 3 land on width minus credit. Row 2 lands a little better because it sells the time value instead of discarding it.
None of them is worse than the max loss you agreed to when you opened the trade.
The decision rule
To cut to the chase, here's the rule of thumb. Conditions first, then the honest limits.
The rule
If you can't fund the shares (cash account short on cash, or a margin account that can't carry them), act FIRST, before anything else. Don't hold. Pick exercise or sell-both today.
If the long option is worth noticeably more than its intrinsic value and the market is open with reasonable bid/ask spreads, sell the long option and the shares. That keeps the time value (Row 2).
If the long option has little or no time value, or its bid/ask spread is wide enough to eat that time value, exercise it. Clean, simple, max loss locked (Row 1).
If you can comfortably carry the shares, understand you're financing them, and want the shares' upside with the put as a floor, holding is a legitimate choice (Row 3). Just know that the put's time value disappears by expiration and the cap stays at the same −$1,345.
What if you can't afford the shares?
The thing is, $78,000 of SPY is a lot of stock for a position you thought risked about the width of the spread.
If the account can't support it, the broker may issue a margin call or liquidate on its own schedule. Sometimes that means selling the shares and leaving the long put sitting there by itself. That lone put is a whole different position from the spread you had.
Beat them to it. Exercise or sell both yourself, on your timing.
The gap between steps
If you sell the shares and the put as two separate orders, there's a window where you hold one without the other.
Sell the put first and you're holding 100 unhedged shares.
Sell the shares first and you're holding a naked long put (less dangerous, but not what you planned).
If your broker lets you send both as one combined order, that closes the gap. If not, do them back to back, not hours apart.
Assigned over the weekend or after hours?
You'll often see the shares on Monday morning. First things, in order:
Confirm what you hold: shares, the long option, the cash balance.
Check whether the account can carry the shares at all.
Decide which row you're in before the open, so you're not deciding with a moving price.
The bear call mirror
Same logic, flipped. When the short call is assigned, you're short 100 shares at the short strike, and cash comes IN instead of out.
Your exits are the mirror image:
Exercise the long call – buy 100 shares at the long strike to cover the short shares.
Buy back the shares and sell the long call – keeps the call's time value.
Hold – stay short shares with the long call capping how high your loss can go.
Max loss is still width minus credit, same arithmetic as above.
But being short shares has two extra costs the put side doesn't:
If you're short over an ex-dividend date, YOU owe the dividend to whoever lent you the shares.
Your broker may charge a borrow fee to stay short.
Those come out of your pocket on top of the spread's math, so holding a short-share leg is usually the less attractive choice.
The honest limits of this rule
The table uses marks. Real fills can differ, especially in fast markets.
"Can you fund the shares" depends on your account type and broker rules, which I can't see from here. Check them.
Commissions and exercise fees vary by broker and aren't in the table.
Nothing here says which way SPY moves. The rule only picks how to unwind; it doesn't pick a direction.
Run it on your own numbers
Your strikes, your credit, your share price. Let's put them through the same comparison.
Step 1: the spreadsheet
Open the template from the worked example section. On the Choices sheet, change:
Net cash before today – your credit, minus your debit, minus the cost of the assigned shares (strike × 100).
Cash today for each row – long strike × 100 for exercise; long option price × 100 plus share price × 100 for sell-both; zero for hold.
Stock price at expiration – try a few prices on the hold row to see where the floor kicks in.
Then check yourself: does the exercise row land on width minus credit? If it doesn't, something in the ledger is off. Please, please, please do this check. It catches typos before they cost money.
Step 2: the Position Analyzer
The link below opens this exact worked example in the Position Analyzer with the legs filled in: the long $762 put and a stock leg of 100 shares.
Run it on your own numbers: Open this SPY example in the MetisTrades Position Analyzer and change the strike, expiration and prices to yours
Once it's open, look at the strategy legs. The stock leg and the surviving put show up together as one position, which is how you should think about them. In the screenshot, pay attention to the payoff curve: flat on the left (that's the put's floor) and rising on the right (that's the shares).
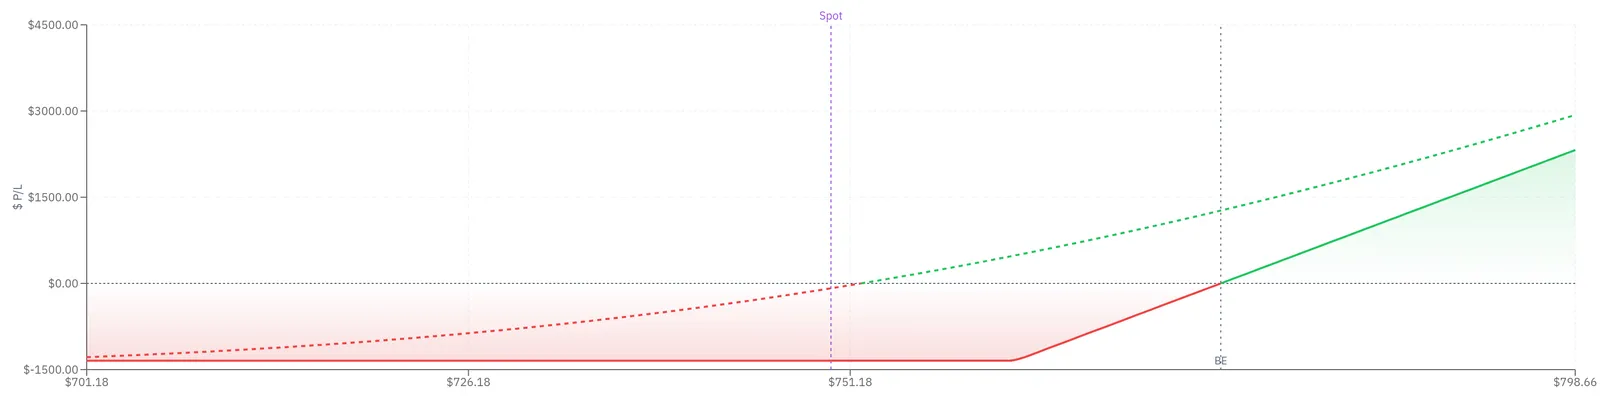
The worked example in the Position Analyzer: Bull put spread, short put assigned early, long put still open, at the example's share price of $749.92.
Now make it yours:
Change the put's Strike and Expiration to match your long leg.
Edit the Stock (100 shares) leg's entry value to your assigned strike, and set the share count to match your contracts.
Load your symbol so the Underlying price updates. Quotes are delayed, so treat the price as a reference, not a fill.
Read Max loss under Payoff at expiration. That's your floor.
Slide Days forward to compare today's dashed curve with the expiration curve. The space between them is the put's time value, ie. what Row 2 collects and Row 1 throws away.
If you track your trades in MetisTrades, the Open in Position Analyzer button on Open Positions does the leg setup for you from your imported history.
Step 3: reading it on your records afterward
After you import the transactions, the Assign/Exercise page (Top nav → Analysis → Assign/Exercise) shows the event with a Put Assigned badge. For a put assignment it records the strike as the share basis, so stock P/L at the moment of assignment is zero and the option premium is tracked separately.
When you later sell the shares, it can match that sale and estimate Disposition P/L. Add the premium, the stock result and the disposition together and you get the whole story of the trade, which should reconcile back to one of the three rows above.
Those are estimates from your imported transactions. Your broker's official tax forms are the real record.
The point is…
Assignment didn't blow up your spread.
It didn't raise your max loss.
It just split one position into two pieces on your statement.
Your job in the next hour is to put them back together on purpose, with the cash and timing you choose, instead of letting someone else choose for you.
Did this clear up what you were staring at in your account? And if you ran your own numbers, did the exercise row land on width minus credit, or did you find a case where it didn't?
Related guides and help pages
Related guides
Assigned early on a covered call the day before ex-dividend: what happened and what to do now
PMCC short call in the money: roll it, close both legs, or exercise the LEAPS?
Assigned and 15% under water: where do you sell the first covered call?
A gap blew through your short strangle: damage control without doubling down
Your short put is deep in the money with a week left: take assignment, roll, or close?
Covered call in the money before expiration: let the shares go, roll up and out, or buy it back?