Your short put is at 80%+ profit with weeks left: close it, redeploy it, or wait?
Weigh what is left to collect against what a normal move could cost you, per day, then hold the "close and resell" trade to the same test. One SPY short put is run through all three choices.
You sold a put, the stock ran the right way, and now the option is worth pennies with weeks still on the clock. Every forum says "just close it at 50%" or "close at 80%" and moves on. This post is an attempt to explain WHY you'd close (or not) in terms of your own numbers: what you can still earn, what a normal move could cost you, and whether the shiny new trade you'd open instead is actually better or just a new risk wearing a nicer outfit.
The situation
Here's the spot.
You're short one SPY $680 put. You sold it 25 days ago for $2.20 per share, when SPY was at $719.92. SPY has since rallied to an illustrative $749.92 (example prices, not a live quote), and the put now marks at $0.02.
There are 20 days left.
So the question in your head sounds something like: "I already have almost all of it. Do I sit here for three more weeks to squeeze out two cents? Or do I buy it back and put the money to work?"
The thing is, it's not obvious.
The leftover premium looks tiny. But the risk looks tiny too, because the strike is way below the price. Tiny versus tiny. Which tiny wins?
A few terms before we go further:
Theta – how much an option's price shrinks per day from time passing alone, ie. what you "earn" each day as the seller if nothing else changes.
Delta – how much the option's price moves for a $1 move in the stock.
Gamma – how fast delta itself changes as the stock moves. Simply put, gamma is the "it was fine and then suddenly it wasn't" Greek.
1σ move (one standard deviation) – a normal-sized move the options market is pricing in over a stretch of time. NOT a worst case. Roughly a one-in-three kind of move, which happens all the time.
Most of the pages that rank for this question hand you a percentage. Close at 50%. Close at 75%. Close at 21 days. Meh.
A percentage tells you how much you've collected. It says nothing about what's left to collect versus what's left to lose.
That's the real question…
The realistic choices
Let's go down the list. There are really three choices here (rolling to a new strike and date is just choice three done in one order ticket).
1. Hold the put to expiration
No trade today. You keep the obligation to buy 100 shares of SPY at $680 if it finishes below that, and you keep whatever is left of the premium if it doesn't.
What it buys you – the last $0.02 per share, no commission, no bid-ask cost.
What it gives up – the cash securing the put stays locked up for 20 more days, and you keep the tail risk of a sharp drop. Small odds, big size.
2. Buy the put back and stay in cash
You pay $0.02 per share to close. The trade is done.
What it buys you – a locked-in result, and the capital is free. No overnight surprises, no assignment, nothing to watch.
What it gives up – the last $0.02, plus whatever commission your broker charges on the buy-to-close. (Check that one. On an option this cheap the commission can be bigger than the premium you're buying back. Kinda silly, but real.)
3. Buy it back and sell a fresh put further out
Close the $680 put at $0.02 and sell the 45-day $710 put at $2.50. Net credit today: $2.48 per share.
What it buys you – a lot more premium to earn over the next 45 days.
What it gives up – this is a NEW trade. A higher strike, closer to the current price, more capital tied up, and 45 more days of exposure.
"But, but, but, it's a credit! Money in!!"
Sure. And it's money in because you took on more risk. No free lunches.
The worked example
Let's run the scenarios. All three choices go through the same example, with the same SPY price of $749.92 and the same prices from the pricing model at 15% volatility.
The spreadsheet below has this exact example with its formulas, one row per choice, and blank rows for your own:
Download the template: Short SPY put mostly profitable, three weeks left — choices compared (.xlsx). It opens in Excel, and in Google Sheets via File → Import. The worked example from this guide is already filled in, and the formulas carry down into the blank rows.
Here's what it computes, per contract (one contract = 100 shares):
Choice | Cash today | Still in a trade? | Breakeven stock price | Capital tied up | Locked-in P/L if you end flat | Worst case (stock to $0) |
|---|---|---|---|---|---|---|
Hold the $680 put to expiration | $0 | Yes | $677.80 | $68,000 | – | -$67,780 |
Buy it back at $0.02, stay in cash | -$2 | No | none | $0 | $218 | $218 |
Buy it back, sell the 45-day $710 put at $2.50 | $248 | Yes | $705.32 | $71,000 | – | -$70,532 |
The formulas, spelled out:
Cash today = cash per share × contracts × 100; ie. -0.02 × 1 × 100 = -$2 for closing, and 2.48 × 1 × 100 = $248 for close-and-resell.
Breakeven = strike − premium already collected − cash today; ie. 680 − 2.20 − 0 = $677.80 for holding, and 710 − 2.20 − 2.48 = $705.32 for the new put.
Locked-in P/L (only for choices that leave you flat) = (premium collected + cash today) × 100; ie. (2.20 − 0.02) × 100 = $218.
Worst case = (everything collected − strike) × 100; ie. (2.20 − 680) × 100 = -$67,780 for holding, and (2.20 + 2.48 − 710) × 100 = -$70,532 for the new put.
So what does the table actually say?
Holding vs closing – the difference is $2 per contract. That's it. Holding buys you two dollars and keeps $68,000 of obligation alive for 20 days. Closing costs you two dollars (plus commission) and frees it all.
Closing vs redeploying – redeploying brings in $248 today, but the breakeven jumps from $677.80 to $705.32 and the capital at stake goes from $68,000 to $71,000. The new put is much closer to where SPY is trading.
What the table does NOT say – it doesn't say which choice makes more money. Nobody knows that. It shows what each choice locks in, what it ties up, and how bad the extremes are. The "stock to $0" row is a ceiling, not a forecast. It's there so you see the size of the obligation you're carrying, not because SPY is going to zero.
Now the part the percentage rules skip. Turn the leftover into a reward-versus-risk test:
Remaining reward = what the option is worth now, ie. what you'd still collect if it expires worthless. Here, $0.02 per share over 20 days.
Size of a normal move = stock price × IV × √(days left ÷ 365).
Remaining risk ≈ delta × that move + ½ × gamma × that move², ie. roughly how much the put's price would rise if SPY dropped by one normal move.
The ratio = remaining reward ÷ remaining risk. Divide both by days left if you want it per day.
Then do the SAME math on the new $710 put, with its own price, delta, gamma and 45 days. If the new trade's ratio isn't better, the extra premium is just a bigger bet, not a better one.
On gamma, since people ask: for a put this far out of the money, gamma today is small. The danger isn't gamma right now. It's gamma after a move toward the strike, when the put stops behaving like a lottery ticket and starts behaving like an actual position, with less time left to recover. That's why the ½ × gamma × move² term is in there.
To see this example laid out, open it in the Position Analyzer. Look at the gap between the dashed Today curve and the solid At expiration curve near the $680 strike, and where Spot sits relative to it:
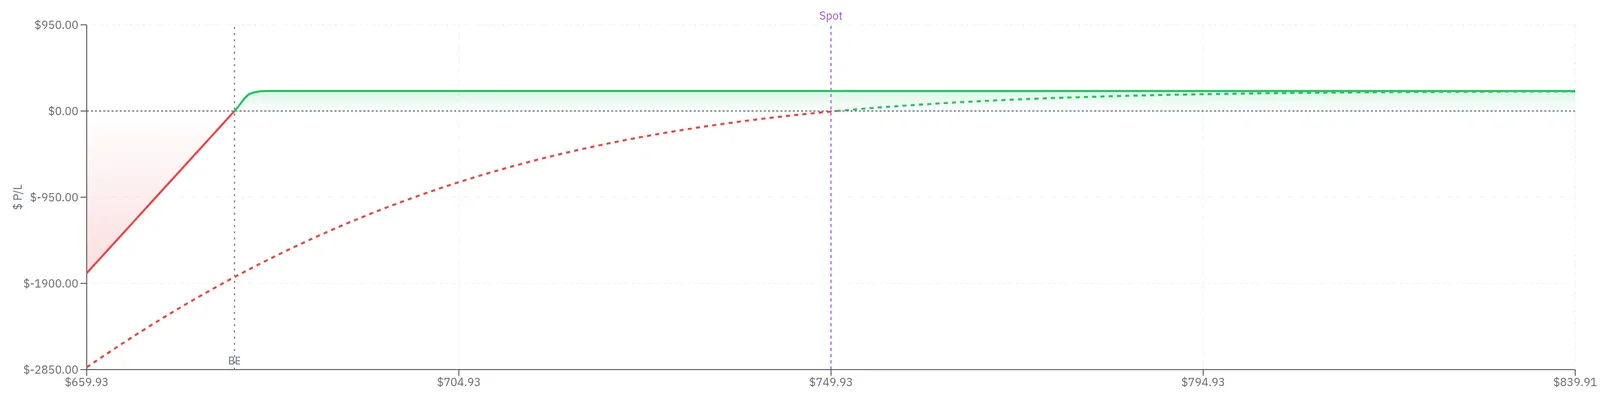
The worked example in the Position Analyzer: Short SPY put mostly profitable, three weeks left, at the example's share price of $749.92.
The decision rule
To cut to the chase, here's the rule of thumb:
If the remaining premium is small next to the loss from a single normal move over the days left, then closing is the cheaper way to hold that risk… you're getting paid pennies to keep it.
If the strike is so far away that even a normal move barely changes the option's price, and commissions or the bid-ask would eat the leftover anyway, then holding is a reasonable choice. Just know what you're holding.
If you'd redeploy, then the new trade has to beat the old one on the same ratio, after the cost of the buy-to-close AND the bid-ask on the new sale. Higher premium alone doesn't count.
If IV is elevated or there's an earnings date or other event before expiration (not a SPY thing, but very much a single-stock thing), then the normal move is bigger and the remaining risk side grows. Rerun it.
Is 80% a different decision from 50%? Nope.
Same test, different inputs. At 50% there's more reward left, and usually more risk too. The percentage alone isn't the trigger; strike distance, IV, and days left are what flip the answer.
Same framework, other positions:
Covered call – the "risk" is mostly the stock rallying through the strike and your shares being called away. Add the ex-dividend date (short calls get assigned early around it), and remember closing creates a realized result for taxes. Your broker's forms are the official word on that, not any spreadsheet.
Credit spread – the long leg caps the loss, so the risk side is capped too. Same ratio, but two legs means two bid-ask spreads to cross when you close.
And the profit-target backtests? Several vendors publish SPY studies comparing "hold to expiration" with closing at 25%, 50% or 75% of max profit. They're useful context and that's about it. They mix strangles, condors and spreads, they use different dates and setups, and their conclusions don't agree (some favor a 50% target, others favor 75% on average P/L). None I've seen tests 80% specifically. Treat them as one data point each, not a law.
The honest limits of this rule: the 1σ math assumes a normal-ish move, and markets gap. Greeks change as price and time move. Delayed quotes and fills at the bid-ask mean your real close price can differ from the mark. And I don't know where SPY goes over the next 20 days.
Neither does anyone else.
The rule doesn't tell you what will happen. It tells you what you're being paid to keep the risk.
Run it on your own numbers
Open the example with the legs already filled in:
Run it on your own numbers: Open this SPY example in the MetisTrades Position Analyzer and change the strike, expiration and prices to yours
Then make it yours:
Change the leg – set the strike, expiration and Price (per share) to your own put (or call). Use Add leg with Stock (100 shares) if it's a covered call, so the payoff includes your shares.
Pick a price mode – Natural uses the bid when you sell and the ask when you buy, which is the more honest assumption for a close-and-resell comparison. (If the spread is stale from a prior session, the page forces Mid.)
Read the Greeks – Delta is shown to everyone. Gamma, Theta /day and Vega are Pro in the Position Analyzer, so if you don't have them, take delta and gamma from your broker's chain and plug them into the formula above.
Stress it – move Days forward toward expiration and slide IV adjustment up and down. Watch what a normal-sized drop does to the dashed curve with fewer days left. Or switch to the heatmap to see price and date together.
Build the new trade – clear it and enter the put you'd sell instead, with its own strike, expiration and price. Run the same ratio. Compare.
Optional – under Close:, choose Profit target to model a planned exit. Pro users can open Best close plan for these legs, which compares 25% through 90% targets with and without stops. They're model estimates, not promises.
Then drop your numbers into the spreadsheet rows so the cash today, breakeven, capital and worst case sit side by side. If you track exit plans in Plan: Positions (Pro), note the Near target status kicks in at 80% of the way to your profit target, which is a nice nudge to run this comparison before the decision sneaks up on you.
Remember: quotes are delayed, and the analyzer doesn't place trades. It just shows you the numbers.
The moral of the story…
It's not about the percentage.
It's not about the "free money" in the last few cents.
It's what's left to earn versus what a normal move could cost, and whether the replacement trade passes the same test.
Please, please, please run your own position through it and check the math. Did this way of framing it change how you'd handle your next 80% winner? Or does a flat rule still feel better to you?
Related guides and help pages
Related guides
A gap blew through your short strangle: damage control without doubling down
Assigned early on a covered call the day before ex-dividend: what happened and what to do now
One leg of your credit spread was assigned early: the cleanup, step by step
PMCC short call in the money: roll it, close both legs, or exercise the LEAPS?
Your short put is deep in the money with a week left: take assignment, roll, or close?
Covered call in the money before expiration: let the shares go, roll up and out, or buy it back?