AI Projections: chart outlooks you can check later
AI Projections queues a model-generated chart outlook for a symbol and target date, saves the run, and scores it once the date passes and a close is captured. Here is how to run one, read it, and audit it later.
What it does and when to use it
AI Projections creates a model-generated chart outlook for one symbol and one future target date. The run produces a chart image, a predicted price, a low-to-high range, a directional bias, support and resistance levels, and a written analysis. Every completed run is saved in History, so the forecast you made three weeks ago is still there, unedited, when the date arrives.
That last part is the point of the tool. A forecast you cannot look up later teaches you nothing. Once the target date has passed and an actual close has been captured, MetisTrades scores the saved run against what happened: whether the direction was right, whether the close landed inside the predicted range, and how far off the predicted price was in percentage terms.
A few terms used throughout, in plain words:
- Current — the price used as the starting point for the model's run.
- Predicted — the model's estimated price for the target date you chose.
- Projected percentage change — predicted price minus current price, divided by current price.
- Range — the model's estimated low-to-high band for the target date.
- Bias — the model's directional label, such as bullish, bearish or neutral.
- Support and Resistance — model-identified price areas where declines may meet buying interest, or advances may meet selling interest.
- Actual close — the later captured closing price used to score a target whose date has passed.
- Scored — a completed projection that has a captured actual close. Unscored runs do not enter the accuracy ratios.
Use it when you want a dated, written-down outlook attached to a position you already hold, and you want a record of how those outlooks have held up. It is not a trade picker. Support, resistance, bias, price and range are estimates and can be wrong, and a projection is model output rather than advice or a promise of future performance.
AI Projections is for Pro users: a signed-in account with an active subscription or lifetime access. Anonymous visitors who reach the page see Sign In Required, with a Sign In button and a Start Free Trial link. Projection history belongs to the signed-in user; it is not a public feed.
A worked scenario
You are short a covered call on XYZ — shares you own, with a call sold against them — expiring in 30 days. You would like a dated outlook for that expiration so that, after the fact, you can see whether your expectation of a drift higher was reasonable or just hopeful.
You run a projection on 1 March for symbol XYZ with a target date of 31 March. About 90 seconds later it completes with these figures:
| Field | Value |
|---|---|
| Current | 50.00 |
| Predicted | 52.50 |
| Projected percentage change | +5.00% |
| Range | 47.80 – 56.20 |
| Support | 48.60 |
| Resistance | 54.00 |
| Bias | Bullish |
The projected percentage change is arithmetic you can check: 52.50 − 50.00 = 2.50, and 2.50 ÷ 50.00 = 0.05, or 5.00%.
Ten days later, on 11 March, you run XYZ again for the same 31 March target. XYZ is now trading at 51.20 and the new run predicts 52.00, still bullish. Because the symbol and target date match, MetisTrades groups the two runs together and plots how the predicted price evolved: the earlier run's 52.50 marked against the newer 52.00, a difference of $0.50 lower. The bias did not change, so no directional flip is marked.
After 31 March passes and the close is captured at 51.45, the saved runs gain an Actual close figure and are scored. For the 1 March run:
- Direction — predicted a move up from 50.00; the captured close of 51.45 is above 50.00, so direction agreed.
- In range — 51.45 sits inside 47.80 to 56.20, so yes.
- Signed percentage error — actual minus predicted, divided by predicted: (51.45 − 52.50) ÷ 52.50 = −1.05 ÷ 52.50 = −2.00%. The negative sign means the close came in below the prediction.
The rest of this guide follows that XYZ scenario.
Step by step in MetisTrades
1. Open the page
Go to Top nav → Research → AI Projections, at the route /research/projections. You can also start a projection from an open position card, which is the quicker route when you already have the position in front of you.
2. Fill in the New projection card
The New projection card has two inputs and two actions. Enter Symbol — a stock, crypto or index ticker; the on-screen examples include AAPL, BTC-USD, ^SPX and ^VIX. The field accepts up to 32 characters and converts your entry to uppercase, so typing xyz becomes XYZ. Then set Target date. It opens 30 days ahead by default, which matches our scenario; you can choose today or any future date instead.
Pick the target date deliberately. Matching it to an expiration you actually hold is what makes the later score useful — you are testing the outlook that mattered to a real decision, not a generic one-month guess.
3. Queue the run
Press Run projection. The page reports Projection queued and says the run takes about 90 seconds. Queued and running work continues in the background, so you can navigate away. An in-flight badge beside AI Chart Projections shows how many projections are currently running.
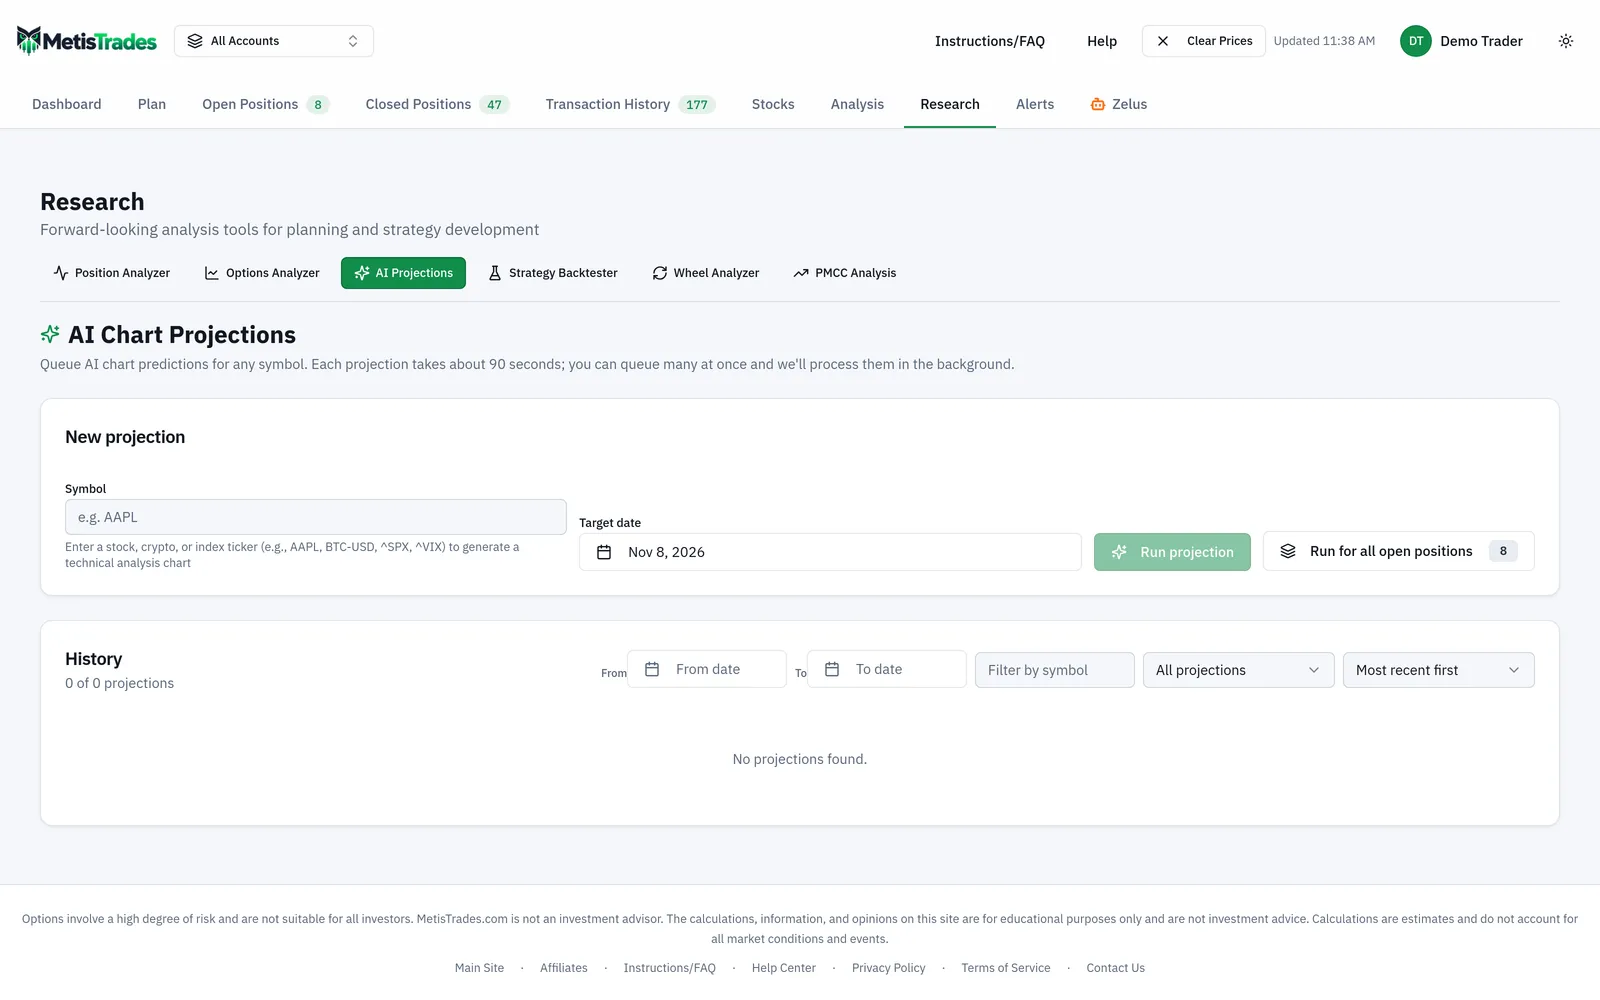
The screenshot below shows the page as you would meet it: the New projection card at the top, and beneath it the saved History with its filters and symbol groups. Look at how completed runs are collected under each symbol, and at the counts the History card reports.
4. Or queue across your open positions
Run for all open positions opens a dialog titled Run projections for open positions. It is available on this page and from the Open Positions toolbar. The dialog builds one candidate per unique symbol-and-expiration pair across your open positions, so if you hold three XYZ positions all expiring 31 March, they collapse into a single projection rather than three.
Candidates are separated into To queue and skipped items, and the dialog shows how many active slots are in use. Press Queue N projections to submit, or Cancel to leave without submitting. Items are skipped when their date is past, when the same pair is already in flight, or when all active slots are occupied. If nothing new qualifies, the dialog says No new projections to queue right now.
The bulk action is limited to one run per day. Using it does not stop you submitting an individual projection from the form or from an open position card.
5. Find the run again in History
The History card shows the number of matching projections, the total saved count, and the number of symbol groups. Narrow the list with From, To, Filter by symbol, and the selectors All projections, Open positions, Closed positions, Future target dates and Past target dates. Sort with Most recent first, Oldest first, Symbol A→Z or Most projections per symbol. Clear resets the date, symbol and projection filters. If nothing matches, the page says No projections found.
For the XYZ review, set Filter by symbol to XYZ and choose Past target dates: that leaves only runs whose target has already arrived, which are the ones eligible to be scored.
6. Expand the saved result
Completed projections are grouped by symbol. Expanding XYZ shows its runs, with target-date groups when several runs share a date — as our two 31 March runs do. The latest summary line shows the bias, target date, current price, predicted price and projected percentage change. Expanding an individual run shows the completion time and model used, the generated chart image (which you can open at full size), Current and Predicted, Actual close once captured, Range, Support, Resistance, and the written analysis.
Queued, running and failed items stay visible in In progress & failed rather than disappearing into a collapsed symbol group. A failed item can be retried, and saved projections can be deleted.
How to read the results
Start with the single run. For the 1 March XYZ projection, the summary reads bullish, target 31 March, current 50.00, predicted 52.50, +5.00%. That tells you the model's central estimate and its direction. The Range of 47.80 to 56.20 is the more informative number for an options trader: it is an estimated band, roughly 4.4% below to 12.4% above the starting price, and it says the model was not confident about a narrow landing spot. Support at 48.60 and Resistance at 54.00 are model-identified areas, not barriers.
What the single run does not mean: it is not a probability of profit for your covered call, it does not account for your strike, premium or assignment risk, and it does not weight outcomes. A predicted 52.50 does not say 52.50 is the most likely close; it says it is the model's estimate.
Next, read the repeat runs. Under the 31 March group, How this projection has changed plots how the predicted price evolved across the two runs. Older rows show their price change versus the immediately newer run, so the 1 March row is marked as $0.50 above the 11 March run, and a directional flip would be marked if the bias had switched. A sequence that drifts gently is a different thing from one that flips bullish to bearish and back; the second tells you the model is reacting to recent price action rather than holding a view.
Then read the scoring. After the close is captured at 51.45, the 1 March run shows Actual close 51.45 alongside its predicted 52.50. Direction agreed, the close was in range, and the signed percentage error was −2.00%. Note the sign convention: positive means the actual close was above the prediction, so our negative value means the model overshot.
Overall accuracy summarizes completed projections that have captured closes, reporting Direction, In range and Mean |err|. If ten of your runs have been scored and seven got direction right, eight closed inside their range, and the absolute errors average 2.9%, that is what those three numbers say. Mean |err| ignores sign, so a run that overshot by 2% and one that undershot by 2% both contribute 2%.
Accuracy by model appears once at least one projection has been scored, with columns Model, Scored, Direction, Range and |err|. The Scored column matters most: a model row with three scored runs is not evidence of anything, however good its percentages look.
Within an expanded symbol, Predictions vs actuals plots the actual close line, predicted target markers, predicted ranges and captured target closes. For XYZ it is the fastest way to see whether your predicted ranges have been wide enough to contain the closes, or whether the markers sit consistently above the line — a persistent bullish tilt you would want to know about before leaning on the next run.
What the accuracy views do not mean: they describe past scored runs under past conditions. A 70% direction figure is not a 70% chance the next projection is right, and "in range" is easier to achieve with a wide range than with a narrow one, so read range accuracy alongside how wide the bands were.
Limits and assumptions
The per-user in-flight limit is 10 queued or running projections. The bulk dialog shows the active cap and current slots in use, so rely on that displayed capacity rather than assuming a fixed number.
The bulk action is available once per day. Individual runs remain available subject to the in-flight limit. Bulk processing uses only open positions with future-dated legs, and it deduplicates shared symbol-and-expiration pairs, so the number of projections queued will usually be smaller than the number of positions you hold.
Each projection consumes paid market data and model-processing capacity, so a run may wait in the queue beyond the stated 90 seconds.
Prices and chart history use delayed quotes or the latest available price, not live execution prices. The Current figure the model starts from can therefore differ from where the symbol is trading when you read the result.
An actual close and accuracy score are unavailable until the target date passes and the close is captured, which is why completed runs can sit unscored. Missing market history can leave the comparison line empty even when projection markers are still available.
Above all, a projection is model output. It is not investment advice, a recommendation, or a promise of future performance, and support, resistance, bias, price and range are estimates that can be wrong.
Common mistakes
- Treating the predicted price as a target to trade against. Fix: read the range, bias and written analysis together, and size the position to the loss you can accept rather than the forecast.
- Choosing a round 30-day target date out of habit. Fix: set the target to an expiration you actually hold, so the later score tests a decision you really made.
- Judging accuracy from a handful of runs. Fix: check the Scored count in Accuracy by model before drawing conclusions from the Direction and Range percentages.
- Assuming a bulk run covers every position. Fix: read the skipped items in the Run projections for open positions dialog — past dates, duplicate symbol-and-expiration pairs and full slots are all excluded.
- Re-running the same symbol repeatedly and only reading the newest result. Fix: open the target-date group and look at How this projection has changed, including any directional flip.
- Expecting a score the day after the target date. Fix: wait until the close is captured; until then the run stays completed but unscored and does not affect the ratios.
- Reading the delayed Current price as the live market. Fix: confirm the price at your broker before acting on anything the projection suggests.
Related guides and help pages
Related guides
- Building and Stress-Testing a Trade in the Position Analyzer
- Screening a Watchlist with the Options Analyzer
- Reading one symbol in depth: the Options Analyzer deep dive
- Backtesting an Options Strategy with the Strategy Backtester
- Testing Wheel Settings With the Wheel Analyzer
- The poor man's covered call, and how to evaluate one