Understanding Roll Chains: Tracking a Rolled Option as One Trade
A roll closes one contract and opens another, but the two belong to the same trade. Learn how to track net credit and lifetime result across a roll chain by hand, then how MetisTrades links the positions for you.
What it is and why it matters
A roll is two trades done as one decision: you close an option you are short or long, and you open a replacement option on the same underlying with a different strike, a different expiration, or both. Most brokers let you submit it as a single combo order, so it feels like one action. In your transaction history it still arrives as two separate fills.
That split is where record keeping goes wrong. If you treat each contract as its own trade, the leg you bought back usually looks like a loss, and the new one you sold looks like a fresh winner. Neither number describes what actually happened. You never walked away from the position; you moved it.
A roll chain is the ordered history that forms when one rolled position leads to the next. An option opened in January, rolled in February, and rolled again in March is three positions and two rolls — one chain. The question worth answering is not "how did the March contract do" but "across the whole sequence, am I ahead, and by how much".
Two numbers do most of the work:
Net credit or debit of each roll — what you paid to close the old contract netted against what you collected on the new one. A roll "for a credit" means the new premium exceeded the buy-back cost.
Lifetime chain cash — every credit collected minus every debit paid since the first opening trade, including fees. This is the number that tells you whether the chain is worth continuing.
Rolling also changes your risk, not just your cash. Moving a short put down in strike reduces the price you would pay on assignment; moving it out in time extends how long your capital is committed. A chain that collects more credit each time but keeps pushing the expiration out is a different trade from the one you opened. Tracking the cash is necessary, but it is not sufficient — note what the strike and expiration did too.
How to track it by hand
The clean way to log this is one row per leg, in date order, with a roll number that groups the two legs of each roll. Record the price per share as a signed number: positive when you collect premium, negative when you pay it. Fees are always a cost, so subtract them.
Three computed columns do the arithmetic:
Leg cash = price per share × contracts × 100 − fees
Chain cash to date = a running sum of every leg cash above and including this row
This roll net = the sum of leg cash for all rows sharing the same roll number (blank for roll 0, which marks the opening trade and the final exit)
The worked example below is a cash-secured put on a $45 strike, rolled down and out twice, then bought back cheaply before expiration. One contract throughout, $0.65 of fees per leg, 100 shares per contract.
The spreadsheet has these rows and formulas already in it, so you can replace the figures with your own.
Download the template: Roll chain tracker spreadsheet (.xlsx). It opens in Excel, and in Google Sheets via File → Import. The worked example from this guide is already filled in, and the formulas carry down into the blank rows.
Date | Roll # | Action | Expiration | Strike | Contracts | Price / share | Fees | Leg cash | Chain cash to date | This roll net |
|---|---|---|---|---|---|---|---|---|---|---|
2026-01-02 | 0 | Sell to open put | 2026-01-16 | 45 | 1 | 1.80 | 0.65 | 179.35 | 179.35 | |
2026-01-14 | 1 | Buy to close put | 2026-01-16 | 45 | 1 | −2.60 | 0.65 | −260.65 | −81.30 | 48.70 |
2026-01-14 | 1 | Sell to open put | 2026-02-20 | 44 | 1 | 3.10 | 0.65 | 309.35 | 228.05 | 48.70 |
2026-02-18 | 2 | Buy to close put | 2026-02-20 | 44 | 1 | −2.10 | 0.65 | −210.65 | 17.40 | 28.70 |
2026-02-18 | 2 | Sell to open put | 2026-03-20 | 43 | 1 | 2.40 | 0.65 | 239.35 | 256.75 | 28.70 |
2026-03-10 | 0 | Buy to close put (exit) | 2026-03-20 | 43 | 1 | −0.35 | 0.65 | −35.65 | 221.10 |
Row by row
2 January, the opening trade. You sell one 45 put expiring 16 January for $1.80 per share. That is 1.80 × 1 × 100 = $180.00 collected, less $0.65 in fees, so leg cash is 179.35. Chain cash to date is the same, because this is the first row.
14 January, roll 1. The stock has fallen and the put is worth more than you sold it for. You buy it back at $2.60: −2.60 × 100 = −$260.00, less $0.65, so leg cash is −260.65. The running total drops to 179.35 − 260.65 = −81.30. On its own, that first contract was a losing trade.
In the same order you sell a 44 put expiring 20 February for $3.10: 310.00 − 0.65 = 309.35. The running total becomes −81.30 + 309.35 = 228.05. The net of the roll is the two legs together: −260.65 + 309.35 = 48.70, which is why both rows show 48.70 in the last column. You rolled down a dollar in strike and out a month, and still took in $48.70.
18 February, roll 2. Same pattern. Buy back the 44 put at $2.10 for leg cash of −210.65, dropping the running total to 17.40. Sell the 43 put expiring 20 March at $2.40 for 239.35, taking the running total to 256.75. Roll net: −210.65 + 239.35 = 28.70. Smaller than the first roll, and worth noticing — each roll is buying you less.
10 March, the exit. The stock has recovered and the 43 put is nearly worthless. You buy it back at $0.35 rather than carry assignment risk into expiration: −35.65. The chain ends at 179.35 − 260.65 + 309.35 − 210.65 + 239.35 − 35.65 = 221.10.
The totals
Chain net result: 221.10 — the lifetime cash of the whole sequence, after fees.
Total fees: 3.90 — six legs at $0.65. Rolling doubles the number of legs, so fees scale with how often you roll.
Number of rolls: 2 — three positions, two transitions between them. Roll count is always positions minus one.
Cross-check it by position instead of by row and you should get the same answer. Position one: 179.35 − 260.65 = −81.30. Position two: 309.35 − 210.65 = 98.70. Position three: 239.35 − 35.65 = 203.70. Sum: −81.30 + 98.70 + 203.70 = 221.10. If those two methods disagree, you have a missing or duplicated row.
This is the point of the whole exercise. A per-trade log would show you a −$81.30 loser followed by two winners. The chain shows one trade that took 67 days and ended at +$221.10, and it shows that the rolls contributed $48.70 and $28.70 of that while the rest came from the final decay.
Where manual tracking breaks down
The spreadsheet works for one chain. It starts failing for predictable, specific reasons.
You log the open and forget the close. The sell-to-open is the exciting half; the buy-to-close is a cost you would rather not look at. Miss that row once and the chain total overstates itself by the full buy-back amount — $260.65 in the example above.
Partial and split fills. Brokers often report one logical order as several fills. A three-contract close that fills as 2 + 1, matched against a replacement that filled in one piece, turns into four rows that you have to combine by hand before the quantities line up.
Scale-ups and scale-downs. Roll one contract into two and the chain is no longer one-in, one-out. You now have to decide which quantity continues the chain and which is a new standalone position — and then remember that decision months later.
Assignment interrupts the chain. If the put is assigned instead of rolled, the option sequence ends and a stock position starts. The premium history is still relevant to your basis in those shares, but it now lives in a different part of your records.
Multiple accounts. The same ticker rolled in two accounts produces two chains that your eye wants to merge. Merging them hides which account carried the risk.
Corrections and backfills. Import a year of history at once and you are reconstructing intent from timestamps and strikes. Which close went with which open? A spreadsheet will not tell you; it only records what you type.
Volume. Six rows is pleasant. Twelve chains across four tickers, each three or four rolls deep, is several hundred rows and a running total that breaks the moment you insert a row in the wrong place.
How MetisTrades does it
MetisTrades builds the same chain from imported transactions. Roll-chain tracking sits on the — Open Positions, Closed Positions, Analysis and the account settings where chains are managed.
Detection, and the setting that controls it
The app starts from option activity on the same date and underlying, then looks for a closing trade and a compatible opening trade: buy-to-close with sell-to-open, sell-to-close with buy-to-open, same option type, quantities close enough to represent the same position size, and a changed strike, expiration, or both. When fill timestamps are available, a close and open filled within 60 seconds are treated as strong combo-order evidence. Without that evidence it falls back to the nearest-strike candidate and deterministic trade details, and a close on its expiration date takes priority over competing same-day candidates. No fill is reused in two different rolls.
Whether this happens at all is one switch. In Account Settings, the Roll Detection card in the Trading Accounts section holds Detect rolls automatically, on by default. Turn it off and only chains you build yourself with the Roll Chain Builder are shown; wheel tracking then follows only put rolls you linked by hand, and scaled-up positions return to first-in, first-out matching. The preference applies to your whole account, every trading account at once, and it is available to Pro members with active access.
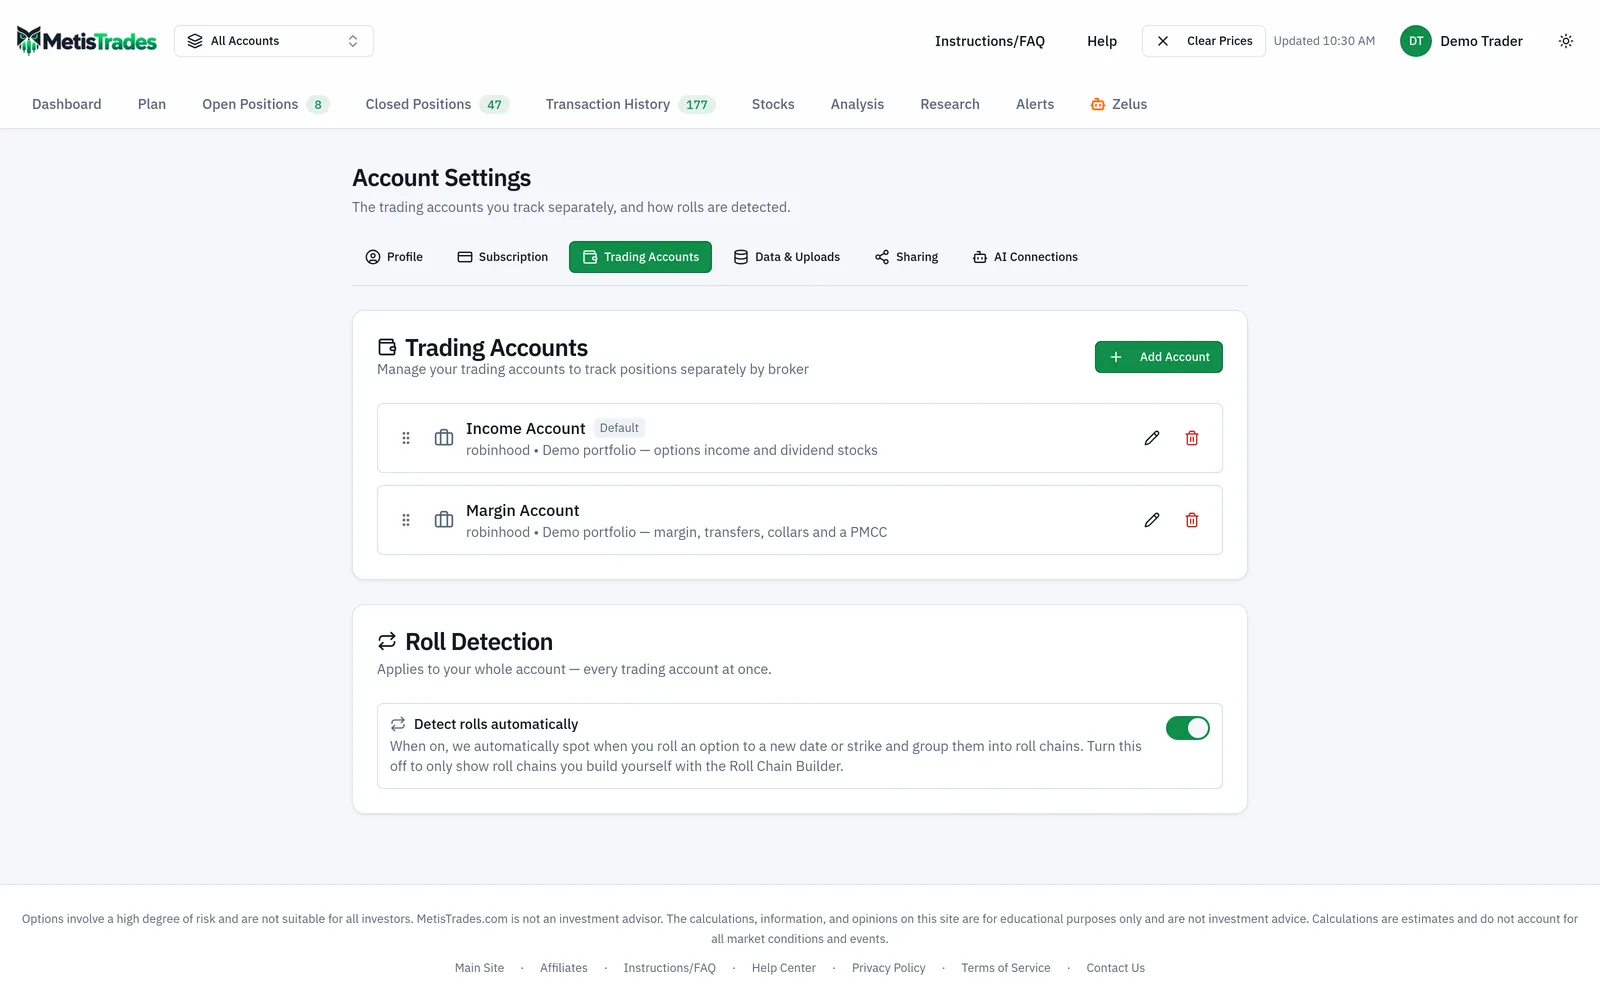
In Account Settings you choose whether rolls are detected automatically or only built by hand.
Position Details and the Roll Chain Builder
Open any position row and the details dialog shows the segment you selected — entry date, Total Credit, Total Debit, and the applicable realized or unrealized P/L. When that position is one segment of a chain, the panel warns that the top figures cover that leg only and links to the chain total. That warning is the app saying exactly what this guide says: the leg is not the trade.
A linked chain with at least two positions shows Complete Roll Chain. Expand Roll Chain History and you get the chain summary — Chain Total P/L, Realized P/L (Closed), Open Position P/L, lifetime credits and debits, current cost to close — followed by each link in order.
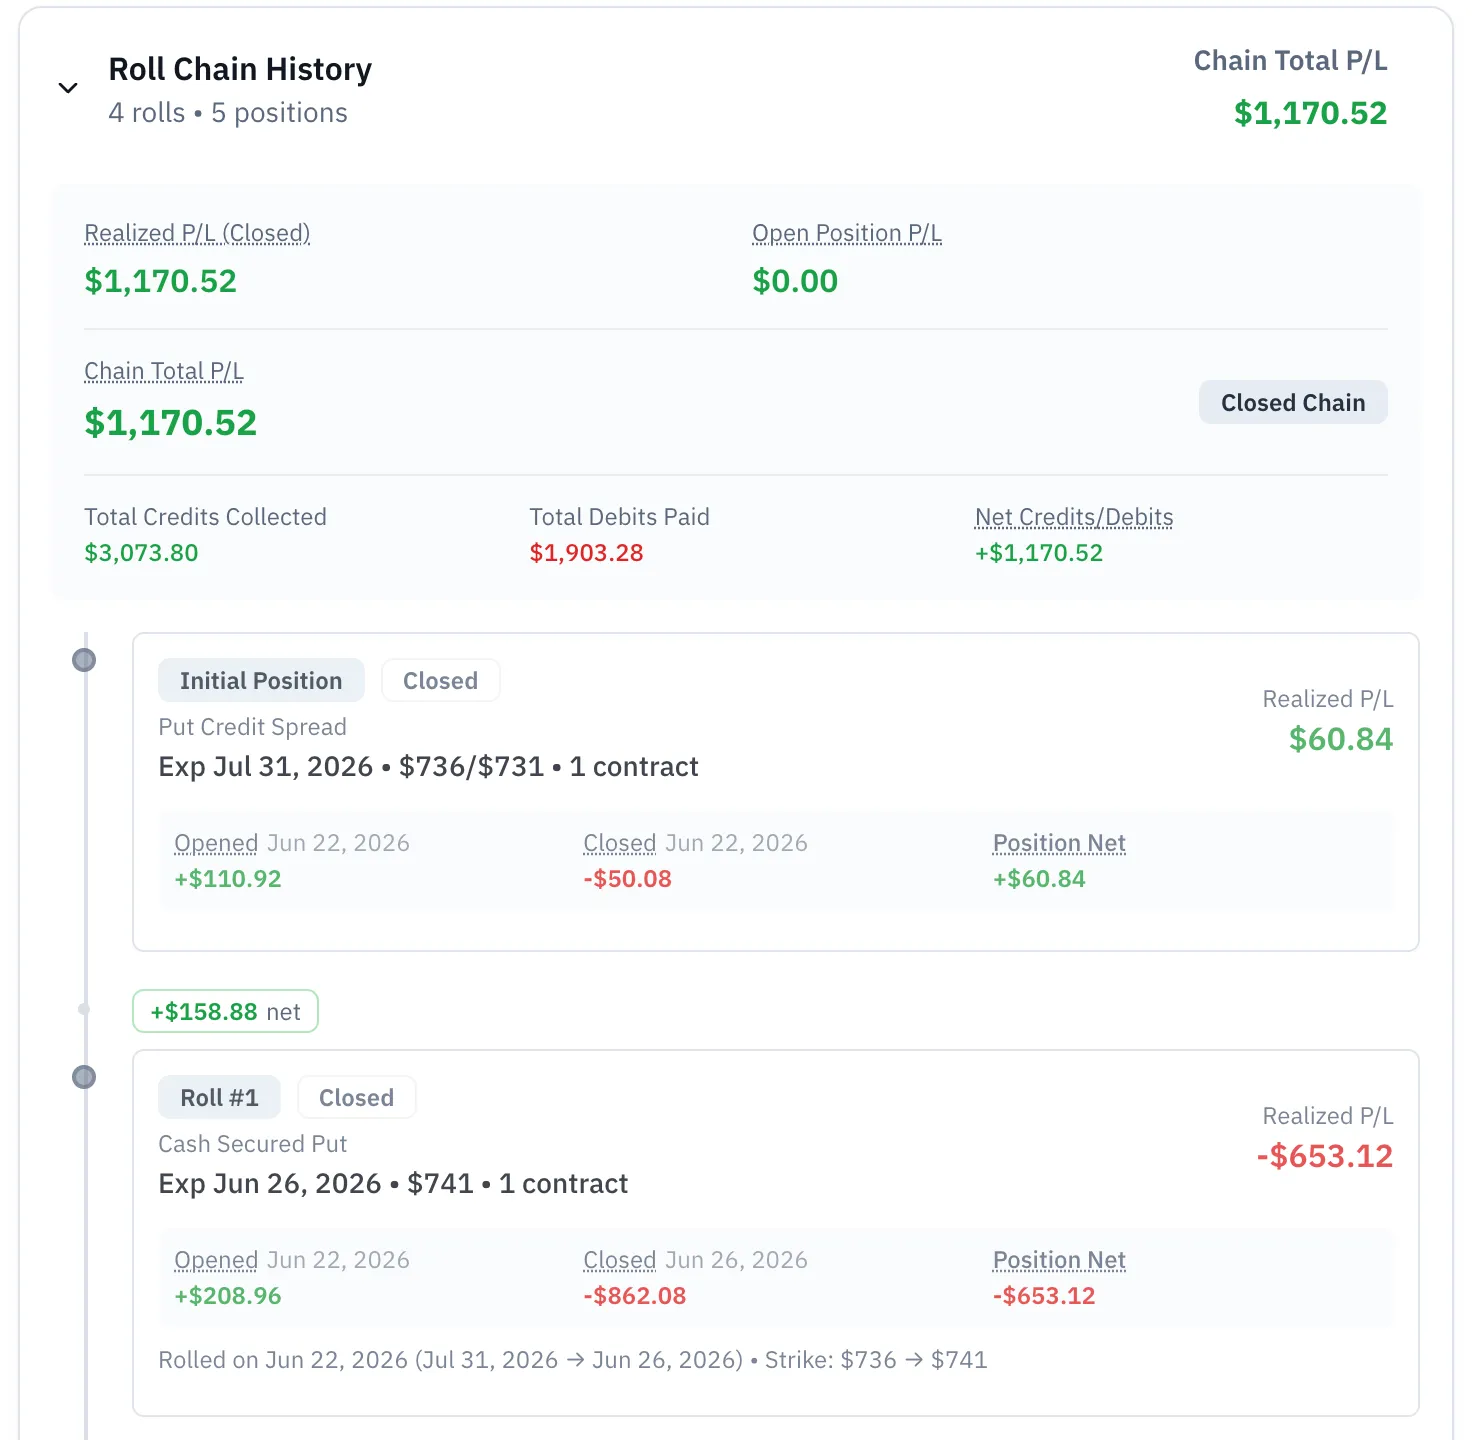
Roll Chain History totals the whole chain, then lists each link in order with its own result.
When detection gets it wrong, use Edit Chain to open the Roll Chain Builder. It starts on Suggested, listing positions for the same underlying with compatible strategy types; All Positions widens it to any option position for that underlying, narrowed by All Strategies, All Status and All Contracts. Select at least two positions and choose Save Chain. Manual links are ordered by entry date and carry an M badge. Leave fewer than two selected and Disconnect Chain separates them; Reset to Auto clears your overrides and lets detection decide again.
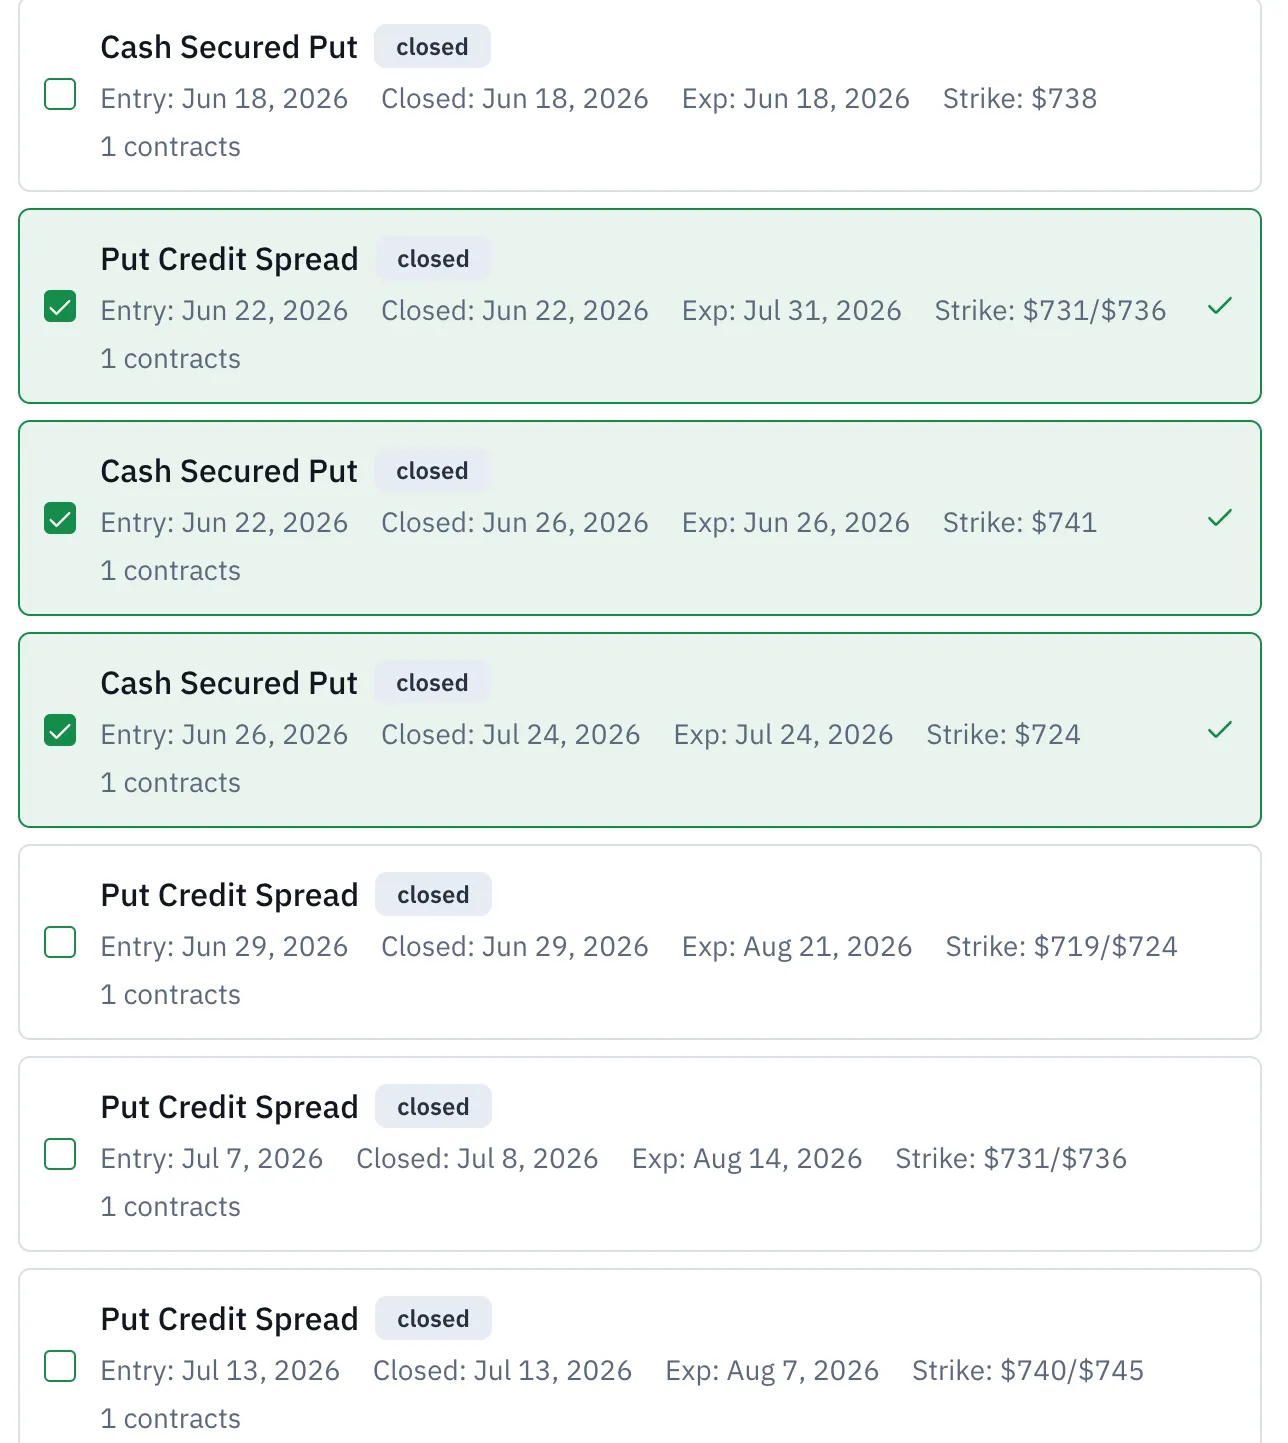
In the Roll Chain Builder, the ticked positions are the ones that will be linked into one chain.
Closed Positions keeps the earlier links
Every contract that was closed by a roll is still a closed position with its own details, which is how you check the chain against your own records leg by leg.
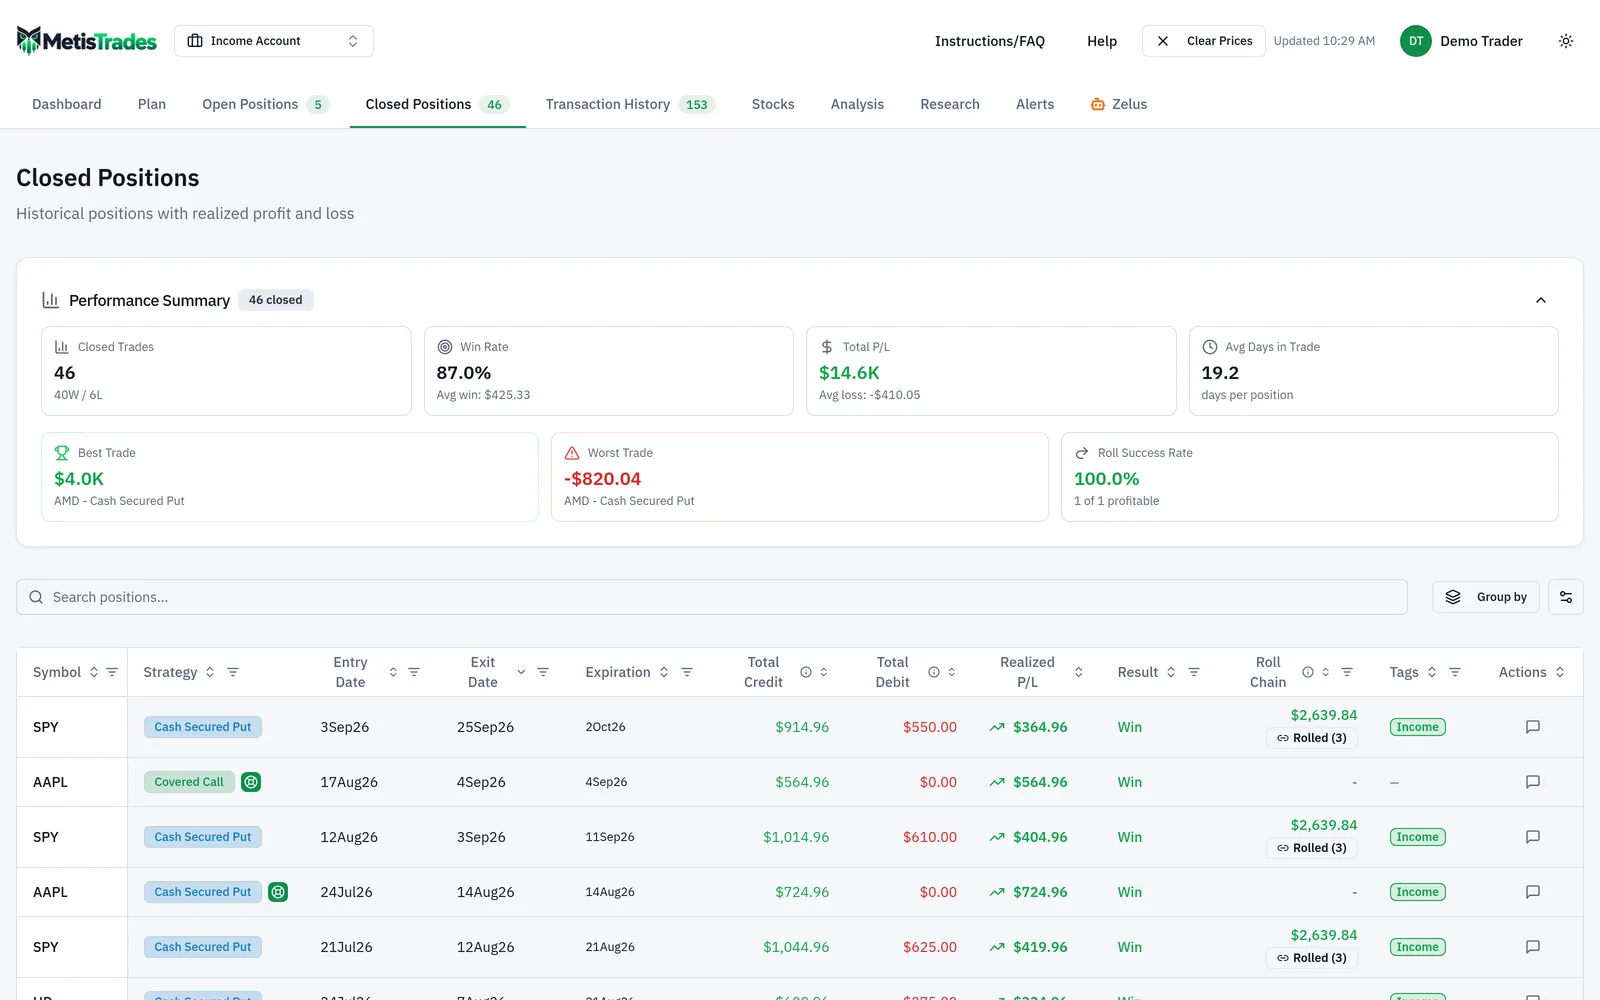
Closed Positions keeps the history of rolled trades, so each leg that was closed by a roll is still visible.
Roll Analysis
Analysis → Roll Analysis is the portfolio-wide view, at /analysis/rolls. Summary cards show Total Roll Chains with total rolls and average rolls per chain, Success Rate, Total Net P/L, and Avg Days Held. A Premium Flow card compares Total Credits, Total Debits and Net Result across the chains that pass your filters. Filter by symbol and by All Status, Open or Closed. The page is available to Pro users and admins.
How to read the results
The Roll Chains table is the manual spreadsheet, rebuilt: sortable columns for Symbol, Strategy, Entry Date, Expiration, Days, Credits, Debits, Realized, Net P/L and Status, with open chains first and the nearest expiration first inside each status group. Each symbol shows its roll count; an M marks a manual chain and a Reclassified badge marks a manually corrected strategy. Select the chevron on a row to reveal Roll History, where each segment is labelled OPEN or ROLL and shows Date, Expiration, Strike, Entry, realized result and status; closed segments add Opened, Closed and Position Net.
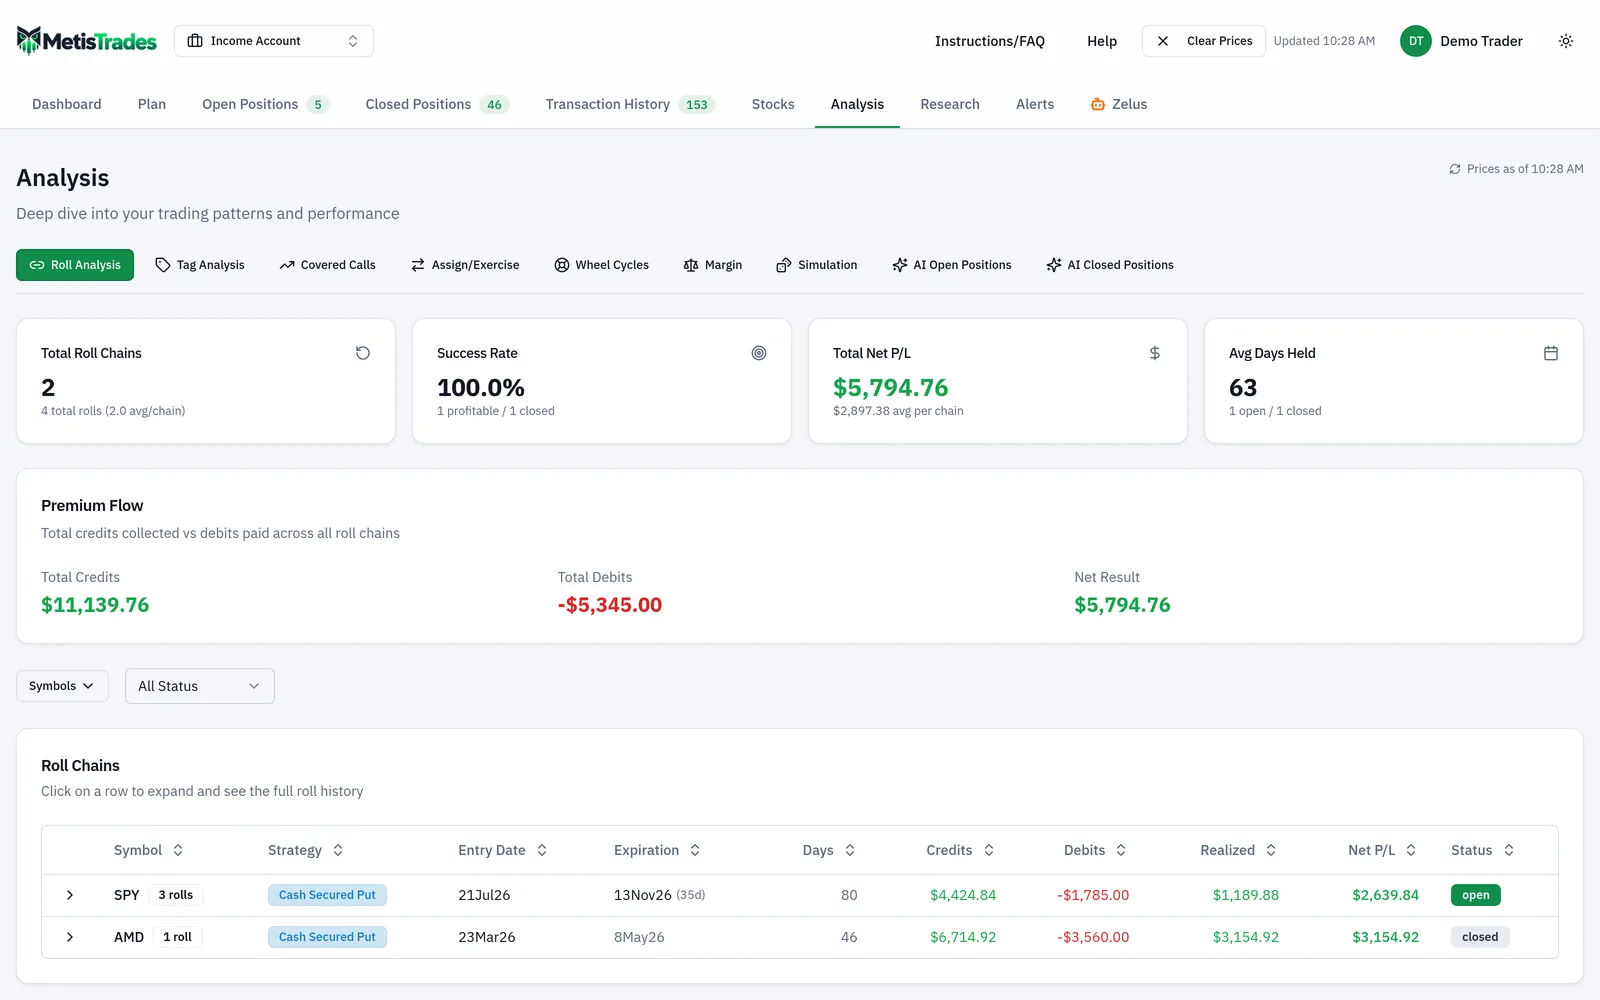
Roll Analysis lists each linked roll chain with its premium flow and lifetime result.
What each figure means, and what it does not:
Credits and Debits are the amounts received and paid across every segment of the chain. In the worked example they would be 179.35 + 309.35 + 239.35 against 260.65 + 210.65 + 35.65. They are not performance; a chain can have large credits and a poor result.
Net Credits/Debits is lifetime option cash: credits minus debits. For an open chain it excludes the cost of closing the still-open option, so it is not what you would bank today.
Realized is P/L from segments already rolled or closed. For a closed chain it is the chain's final net result — 221.10 in the example.
Net P/L is the chain-wide result. For an open chain with a latest available price it combines realized P/L from closed segments with an estimate for the open segment. That estimate moves with delayed quotes.
Chain Total P/L, in Roll Chain History, follows the same rule: final realized result for a closed chain, closed-link P/L plus the open link's estimate for an open one.
Success Rate is profitable closed chains divided by all closed chains. Open chains are excluded, so a portfolio of long-running open chains can show a small, unrepresentative sample here.
Avg Days Held runs from first entry to final exit, or to today for an open chain. The example chain held 67 days — longer than any single contract in it.
Combined P/L, where stock context is available, adds the estimated unrealized gain or loss on the shares backing the chain.
Two cautions. Open-chain figures depend on delayed quotes; when no latest available price exists, the page falls back to the transaction-derived chain result. And everything here is an estimate built from imported transactions — missing opening, closing or replacement trades can split or omit a chain entirely. These are tracking figures, not tax figures.
Common mistakes
Judging the newest contract instead of the chain. The example's first position closed at −$81.30 while the chain ended at +$221.10. Fix: read Chain Total P/L, not the segment summary, and expand Roll History before drawing conclusions.
Logging the new credit but not the buy-back. One missing close row inflated the example by $260.65. Fix: record a roll as two rows sharing one roll number, and reconcile the chain total against a by-position sum.
Treating "rolled for a credit" as profit. Roll 1 netted $48.70 while the running chain total was still negative at that moment. Fix: watch Chain cash to date, and note what the strike and expiration did as well as the cash.
Leaving fees out. Six legs at $0.65 is $3.90 on one chain; rolling doubles the leg count every time. Fix: subtract fees in the leg-cash formula, not at the end.
Assuming detection read your intent. Matching is an inference from imported fills, and a fallback rule can pick a nearby strike you did not roll into. Fix: check the chain's segments, and correct membership with the Roll Chain Builder.
Expecting a scale-up to sit inside one chain. The chain model is linear, so only the dominant one-in, one-out path receives membership and added contracts can remain standalone. Fix: track the extra contracts as their own position rather than forcing them into the chain.
Confusing Net Credits/Debits with Net P/L on an open chain. The first excludes the cost of closing the open option; the second includes an estimate of it. Fix: use Net Credits/Debits for cash collected so far and Net P/L for where the chain stands now.
Related guides and help pages
Related guides
Contract size and the 100-share multiplier: turning quoted premium into dollars
The Greeks in practice: delta, theta, vega and gamma on one position
Keeping Track of Open Positions: Legs, Days to Expiry and Mark-to-Market P/L
Did Your Rolls Pay Off? Measuring Roll Results Across the Whole Chain